
Discover financial empowerment resources
Discover financial empowerment resources
From 2019 to 2022, among Indigenous people aged 18 years and older, 54.3% of Inuit reported having a regular healthcare provider, along with 81.4% of First Nations people living off reserve and 84.5% of Métis. This is compared with 85.7% of the non-Indigenous adult population. Released...
Tables for 14 indicators in Canada's Quality of Life Framework have been updated to include Canadian Social Survey data collected from October to December 2024 (fourth quarter of 2024). These indicators include life satisfaction, sense of meaning and purpose, future outlook, loneliness,...
Statistics Canada has updated preliminary estimates of the Indigenous economy, defined as gross domestic income (GDI) earned by Indigenous workers and Indigenous-led businesses (where 50% +1 of the owners identify as Indigenous), along with data on jobs held by Indigenous people. This latest...

Internet use in Canada is prolific, with 94% of Canadians going online for personal use in 2022, up from 91% in 2018. Not only are more Canadians using the Internet since the COVID-19 pandemic, but more are managing their personal and household finances online. Based on data from the Canadian...
The FCAC has updated their dashboard that present the result of two FCAC surveys: the COVID-19 Financial Well-being Survey and the Survey on Canadians' use of Bank Products and Services. The dashboard was updated in July 2023 with data collected between August 2020 and May 2023. Some indicators...

Two articles released in Economic and Social Reports provide insights on the poverty rates and changing demographics of racialized population groups in Canada. The article "Poverty among racialized groups across generations," shows that most racialized groups had higher poverty rates...
Recent increases in the cost of living and declining real estate values had unprecedented impacts on net saving and wealth for more financially vulnerable households in the first quarter, such as those with lower incomes, less wealth, and in younger age groups. Statistics Canada has gathered data...
In 2022, the Consumer Price Index rose 6.8%, the highest increase since 1982 (+10.9%). Prices for day-to-day goods and services such as transportation (+10.6%), food (+8.9%) and shelter (+6.9%) rose the most. Canadians felt the impact of rising prices. Data from the Canadian Social Survey...
This study uses the 2022 Portrait of Canadian Society Survey to examine the impact of rising inflation on the lowest income Canadians. Using multiple pre-pandemic data sources, the study takes a closer look at people living in the bottom family income quintile, examining their family income, debt...
The Consumer Price Index (CPI) rose 6.8% on an annual average basis in 2022, following gains of 3.4% in 2021 and of 0.7% in 2020. The increase in 2022 was a 40-year high, the largest increase since 1982 (+10.9%). Excluding energy, the annual average CPI rose 5.7% in 2022 compared...
Residents in Canada who have a severe and prolonged mental or physical disability are eligible for the Disability Tax Credit (DTC). This opens the door to other programs, one of which is the RDSP. Less than one-third of eligible residents in Canada (up to age 59) have a Registered Disability...
Statistics Canada has created an "Opportunity for All"; a dashboard of 12 indicators to track progress on deep income poverty as well as the aspects of poverty other than income, including indicators of material deprivation, lack of opportunity and resilience. These indicators are broadly grouped...
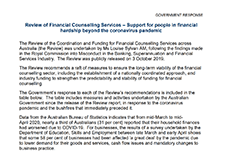
In 2019, a comprehensive review (The Countervailing Power: Review of the coordination and funding for financial counselling services across Australia) of financial counselling services in Australia was undertaken and recommendations to ensure the long-term viability of the financial counselling...
Canadians were more asset resilient just prior to the pandemic than they were at the turn of the millennium. That resilience continues to be tested as we enter the second year of the pandemic. For the purposes of this article, a household is asset resilient when it has liquid assets that are at...
Statistics Canada presents a demographic and social profile of Canada's diverse LGBTQ2+ communities based on published analyses. Much of the data in this release focus on LGB Canadians (lesbian, gay, bisexual), since Statistics Canada has been collecting detailed information on these communities...
The Canada Emergency Response Benefit program (CERB) was introduced to provide financial support to employees and self-employed workers in Canada who were directly impacted by the COVID-19 pandemic. This article examines the proportion of 2019 workers who received CERB payments in 2020 by various...
A highlight of some of the findings reported in this briefing: Disposable income declined for most households in the fourth quarter of 2020, with the largest losses for the lowest-income earners (-10.2%). Compensation of employees—of which wages and salaries make up the largest share—was...
The COVID-19 pandemic has highlighted the varying labour market experiences and outcomes of diverse groups of Canadians. To mark Asian Heritage Month, Statistics Canada is providing a profile of the employment characteristics of the three largest Asian populations in Canada: South Asian, Chinese...
April Labour Force Survey (LFS) data reflect labour market conditions during the week of...
In 2019, non-profit organizations (NPOs)—serving households, businesses and governments—employed 2.5 million people, representing 12.8% of all jobs in Canada. The employment share ranged between 12.4% and 12.8%, increasing during the 2010-to-2019 period. While the economic and social...
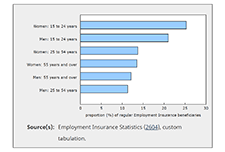
February Employment Insurance (EI) statistics reflect labour market conditions as of the week of February 14 to 20. Ahead of the February reference week, non-essential businesses, cultural and recreation facilities, and in-person dining reopened in many provinces, subject to capacity limits and...
In the context of the COVID-19 pandemic, many Canadians, including Black Canadians, have experienced significant economic hardship, while others put themselves at risk through their work in essential industries such as health care and social assistance. Statistics Canada looked at how the 1...
New data tables on the labour activities of Indigenous Peoples are now available. Data are from the 2017 Aboriginal Peoples Survey and include information on labour force status, job satisfaction, skills training, skills that limit job opportunities, job permanency, part-time or full-time job...
Tables on the income and mobility of immigrants by economic region, and a table on asylum claimant economic outcomes, are now available. These tables use data from the Longitudinal Immigration...
The labour market in Canada has experienced unprecedented changes over the last 12 months. Entire sectors of the economy have been subject to temporary restrictions on business activities as a result of public health measures aimed at limiting the spread of COVID-19. At the same time, many...