Discover financial empowerment resources
Discover financial empowerment resources
Every year, thousands of people in Canada miss out on tax benefits that can significantly increase their income or reduce the amount they owe. For people living on a low income, filing a tax return can mean thousands of dollars more. Check out these resources -- infographics, posters, and social...

See the impact of markets ups, downs, and more based on historical data. Available in...

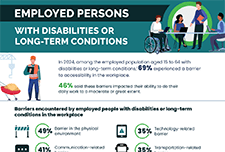
This infographic highlights key findings on accessibility barriers among employed persons aged 15 to 64 with disabilities or long-term conditions. The population covered by the Survey Series on Accessibility - Experiences with Accessibility and Employment (SSA-EAE) comprised those who participated...
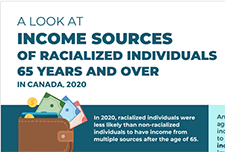
In 2020, racialized individuals were less likely than non-racialized individuals to have income from multiple sources after the age of 65. Among all racialized individuals aged 65 and over, Japanese individuals were most likely to have private retirement income (74%) and investment income...
The Government of Canada has created a digital toolkit for Black History Month 2025. Click on "Access this resource" to download a Black History month poster, a virtual background for video...

The Monthly Financial Well-being Monitor is a survey designed to collect information about Canadians' day-to-day financial management and financial well-being. It collects data from approximately 1,000 respondents per month and is a continuation of the COVID-19 Financial Well-being Survey, which...

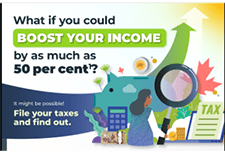
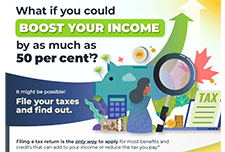
This infographic provides a helpful visual summary of tax benefits that can add to income or reduce the taxes people in Canada pay when they file their tax return. The information is especially useful for people in Canada who: Are working or living on a low income; Live with a...
Understanding Technology-Facilitated Economic Abuse: This form of abuse arises when digital tools are misappropriated to monitor, control, or sabotage an individual's finances. It can take many forms, including tracking online banking, identity theft, restricting account access, and even utilizing...

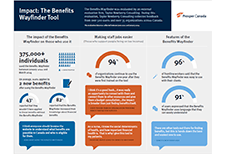
The external evaluation firm, Taylor Newberry Consulting, evaluated the Benefits Wayfinder between June 2022 and January 2024. This infographic and report showcase the feedback received based on feedback collected from 500 users and over 35 organizations across Canada. Impact: L'orienteur en...
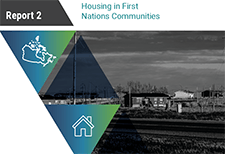
Many people living in First Nations communities do not have access to housing that is safe and in good condition—a fundamental human right. Improving housing for First Nations is vital for their physical, mental, and economic health and well-being. This is the fourth time since 2003 that we...
The Government of Canada has created a digital toolkit for Black History Month 2024. Click on "Access this resource" to download a Black History month poster, a virtual background for video...

This publication is an outreach product to help promote the program "How to open a Registered Disability Savings Plan (RDSP) for yourself or a loved one with a disability". This infographic was created in response to feedback from stakeholders and was designed in collaboration with experts in...
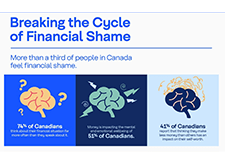
As people in Canada navigate the impacts of a challenging economic environment that includes inflation, the rising cost of living, record debt levels, and high levels of income volatility, we’re seeing a greater connection between financial and emotional wellbeing. With these external factors...
The Canada Learning Bond is money available to children and youth born in 2004 or later from low and moderate income families. You can get up to $2000 from the Government of Canada by opening an Registered Education Savings Plan (RESP). You can access this money when you enroll in full-time or...

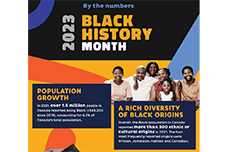
Black History Month is an opportunity to highlight the contributions and accomplishments of Black Canadians and their communities. These Statistic Canada findings provide a brief overview of the Black population that continues to grow with each census. The Black population now accounts or 4.3% of...
A research collaboration between PROOF (Food Insecurity and Policy Research) and FoodShare reveals that Black households are 3.56 times more likely to be food insecure than white households. Learn more about the relationship between food banks and food insecurity in Canada in this 2019...
This infographic by community food centres Canada provides a helpful visual summary of tax benefits that can add to income or reduce the taxes Canadians pay when they file their tax return. The information is especially useful for people: Working or living on a low income; Living with a...
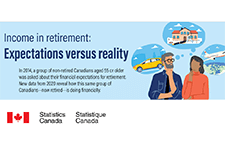
In 2014, a group of non-retired Canadians aged 55 or older was asked about their financial expectations for retirement. New data from 2020 reveal how this same group of Canadians - now retired- is doing...
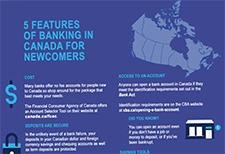
Banks offer extensive information on how newcomers to Canada can get started in their new country, including checklists, information, financial services and advice. Here is some basic information to get you started. A list of bank resources at the end of this article may also help with the...
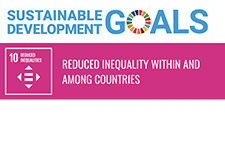
An infographic from Statistics Canada highlighting the advances made in reaching Goal 10, reducing inequalities, of the sustainable development...
Getting cyber safe doesn't have to be complicated. With the right resources and tools, you can stay safe and secure online. Here's a handy checklist for protecting your data...

Black History Month is an opportunity to highlight the contributions and accomplishments of Black Canadians and their communities. These Statistic Canada findings provide a brief overview of personal education, contributions to the scientific community, proportions in the front line staff, and...

This infographic explores 3 forms of economic abuse and associated tactics used to coercively control intimate partners. These abusive tactics are compounded by economic systems that systemically oppress groups including Black, Indigenous, and people of colour; people with disabilities; people...

Le français suit l’anglais. As of June 30, 2022, banks will be required to send electronic alerts to their customers to help them manage their finances and avoid unnecessary fees. Some banks have already started sending these alerts to their customers. The electronic alerts are part of the...

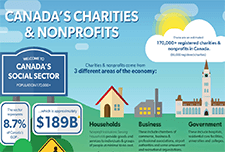
This infographic shows the size, scope, and economic contribution of charities and nonprofits across...