Welfare in Canada, 2020
Maytree released the 2020 edition of the Welfare in Canada report. For each province and territory, this report provides data and analysis on the total welfare income that households receiving social assistance would have qualified for in 2020, including COVID-19 pandemic-related supports. Welfare in Canada is a series that presents the total incomes of four example households who qualify for social assistance benefits in each of Canada’s provinces and territories in a given year. Welfare in Canada, 2020 looks at the maximum total amount that a household would have received over the course of the 2020 calendar year, assuming they had no other source of income and no assets. Some households may have received less if they had income from other sources, while some households may have received more if they had special health- or disability-related needs. The report looks at: In addition, this year the report includes a new section that looks at the adequacy of welfare incomes in each province over time, an analysis that hearkens back to past reports prepared by the National Council of Welfare. Also, please note that this report measures the adequacy of welfare incomes relative to both the Market Basket Measure (MBM) – Canada’s Official Poverty Line – and the Deep Income Poverty threshold (MBM-DIP), which is equivalent to 75 per cent of the MBM. This analysis will replace the low-income threshold comparisons in future reports. We hope these additions will be helpful for those using the report. In each jurisdiction, the total welfare income for which a household is eligible depends on its specific composition. For illustrative purposes, this resource focuses on the welfare incomes of four example household types:
The Cost of Poverty in the Atlantic Provinces
This report costs poverty based on three broad measurable components: opportunity costs, remedial costs and intergenerational costs. The authors state that these costs could potentially be reallocated, and benefits could potentially be realized if all poverty were eliminated. The total cost of poverty in the Atlantic region ranges from $2 billion per year in Nova Scotia to $273 million in Prince Edward Island. It is close to a billion in Newfoundland and Labrador, $959 million, and $1.4 billion in New Brunswick. These costs represent a significant loss of economic growth of 4.76% of Nova Scotia’s GDP to 2.9% in Newfoundland and Labrador. The impact on Prince Edward Island’s GDP is 4.10%, and 3.71% in New Brunswick.
The purpose of this costing exercise is to illustrate the shared economic burden of poverty, and the urgency that exists for Atlantic Canadian governments to act to eradicate it.
Office of the Superintendent of Bankruptcy Canada: Statistics and Research
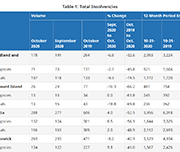
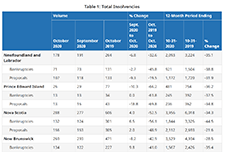
The Office of the Superintendent of Bankruptcy Canada releases statistics on insolvency (bankruptcies and proposals) numbers in Canada. The latest statistics released on November 4, 2020 show that the number of insolvencies in Canada increased in the third quarter of 2020 by 7.9% compared to the second quarter.
Impact of the COVID-19 pandemic on the NEET (not in employment, education or training) indicator, March and April 2020
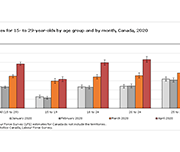
A fact sheet released by Statistics Canada shows that, in March and April 2020, the proportion of young Canadians who were not in employment, education or training (NEET) increased to unprecedented levels. The COVID-19 pandemic—and the public health interventions that were put in place to limit its spread—have affected young people in a number of ways, including high unemployment rates, school closures and education moving online.
Social Assistance Summaries
The Social Assistance Summaries series tracks the number of recipients of social assistance (welfare payments) in each province and territory. It was established by the Caledon Institute of Social Policy to maintain data previously published by the federal government as the Social Assistance Statistical Report. The data is provided by provincial and territorial government officials.
Resources
Handouts, slides, and time-stamps
Presentation slides for this webinar
Handouts for this webinar
Introducing the Financial Relief Navigator (FRN)
Access the Financial Relief Navigator here.
Time-stamps for the video recording:
3:22 – Agenda and Introductions
6:00 – Audience poll
9:00 – Why we created the Financial Relief Navigator (Speaker: Janet Flynn)
11:55 – What’s in the Financial Relief Navigator (Speaker: Janet Flynn)
16:35 – FRN Walkthrough using a Persona (Speaker: Galen McLusky)
33:15 – Tips for using the FRN (Speaker: Galen McLusky)
36:00 – The Working Centre experience using the FRN (Speaker: Sue Collison)
41:15 – Q&A
Community Volunteer Income Tax Program (CVITP) provincial snapshots
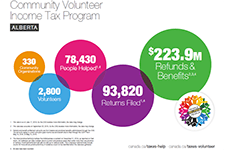
This infographics from the Community Volunteer Income Tax Program (CVITP) show information about the program by province for the tax filing year 2019, including number of returns filed and amount of refunds and benefits accessed. The information is presented in English and French. Les informations sont présentées en anglais et en français.
Welfare in Canada, 2018
These reports look at the total incomes available to those relying on social assistance (often called “welfare”), taking into account tax credits and other benefits along with social assistance itself. The reports look at four different household types for each province and territory. Established by the Caledon Institute of Social Policy, Welfare in Canada is a continuation of the Welfare Incomes series originally published by the National Council of Welfare, based on the same approach.
Urban Spotlight: Neighbourhood Financial Health Index findings for Canada’s cities
This report examines the financial health and vulnerability of households in Canada’s 35 largest cities, using a new composite index of household financial health at the neighbourhood level, the Neighbourhood Financial Health Index or NFHI. The NFHI is designed to shine a light on the dynamics underlying national trends, taking a closer look at what is happening at the provincial/territorial, community and neighbourhood levels. Update July 22, 2022: Please note that the Neighbourhood Financial Health Index is no longer available
Financial Literacy of Indigenous Secondary Students in the Atlantic Provinces
Research conducted by agencies such as AFOA, Native Women’s Association of Canada, and various other Canadian entities, has identified the need for improved financial literacy education in Indigenous communities, particularly among youth and Elders. Such research reports are often equipped with a list of recommendations for improving and addressing the gaps in education around financial literacy. In the spirit of building upon this research into financial literacy and Indigenous peoples, the Purdy Crawford Chair in Aboriginal Business Studies (PCC) proposed a project focused on Atlantic Canada’s 14-18 year old Indigenous population and their levels of financial literacy. The results reveal that the majority of respondents would like to learn more about money. As well, they affirm that face-to-face learning from family members and in classroom settings remain the preferred way to learn about financial issues. Finally, based on the literature review, the environmental scan, survey data, and feedback from the community consultation process, a web application titled Seven Generations Financial Literacy was developed and is located at www.sevengenerationsfinancial.com.
