One of the consequences of social distancing and other restrictions, during the pandemic, such as those on business operating hours, is that consumers spent more of their time searching for information, shopping, and streaming entertainment on-line. With more free time on their hands and money in the bank, a larger percentage of the population took up an interest in investing, often through on-line brokerage platforms or in the cryptoasset markets. Because consumers have been spending more time on-line since the start of the pandemic, they have been more exposed to on-line fraud. In addition to phishing and malware, consumers are dealing with known scams but in digital form, often on social media. For some consumers, the evergrowing number of reliable and accessible information sources could lead to information overload, also known as “infobesity, where there is so much information that the consumer cannot process it all. Infobesity can lead to decision paralysis. In this paper the AMF make the most of their 360-degree view on the financial industry’s digital transformation to review the main changes that occurred in each of their areas of focus, describe the risk of digitalization for the consumers of financial products and services and present the potential opportunities that have been identified to mitigate these risks.
Maytree released the 2020 edition of the Welfare in Canada report. For each province and territory, this report provides data and analysis on the total welfare income that households receiving social assistance would have qualified for in 2020, including COVID-19 pandemic-related supports. Welfare in Canada is a series that presents the total incomes of four example households who qualify for social assistance benefits in each of Canada’s provinces and territories in a given year. Welfare in Canada, 2020 looks at the maximum total amount that a household would have received over the course of the 2020 calendar year, assuming they had no other source of income and no assets. Some households may have received less if they had income from other sources, while some households may have received more if they had special health- or disability-related needs. The report looks at: In addition, this year the report includes a new section that looks at the adequacy of welfare incomes in each province over time, an analysis that hearkens back to past reports prepared by the National Council of Welfare. Also, please note that this report measures the adequacy of welfare incomes relative to both the Market Basket Measure (MBM) – Canada’s Official Poverty Line – and the Deep Income Poverty threshold (MBM-DIP), which is equivalent to 75 per cent of the MBM. This analysis will replace the low-income threshold comparisons in future reports. We hope these additions will be helpful for those using the report. In each jurisdiction, the total welfare income for which a household is eligible depends on its specific composition. For illustrative purposes, this resource focuses on the welfare incomes of four example household types:
This exploratory study aims to better understand the challenges experienced by members of cultural communities in Montreal, particularly the most disadvantaged groups, during the COVID-19 pandemic in the Spring of 2020.
A guide for consumers to help with problems related to communications services. Information is provided to allow consumers to better assert their rights and facilitate the resolution of a dispute with communication service providers. (Please note this is a French-language resource.)
A guide comprised of 12 fact sheets for consumers to learn more about credit, grouped into the following topics: general information, warnings, credit products, and comparison tables. (Please note this is a French-language resource.)
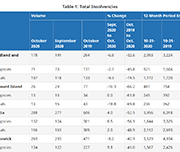
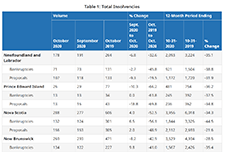
The Office of the Superintendent of Bankruptcy Canada releases statistics on insolvency (bankruptcies and proposals) numbers in Canada. The latest statistics released on November 4, 2020 show that the number of insolvencies in Canada increased in the third quarter of 2020 by 7.9% compared to the second quarter.
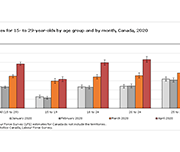
A fact sheet released by Statistics Canada shows that, in March and April 2020, the proportion of young Canadians who were not in employment, education or training (NEET) increased to unprecedented levels. The COVID-19 pandemic—and the public health interventions that were put in place to limit its spread—have affected young people in a number of ways, including high unemployment rates, school closures and education moving online.
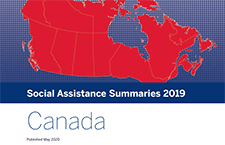
The Social Assistance Summaries series tracks the number of recipients of social assistance (welfare payments) in each province and territory. It was established by the Caledon Institute of Social Policy to maintain data previously published by the federal government as the Social Assistance Statistical Report. The data is provided by provincial and territorial government officials.
Handouts, slides, and time-stamps
Presentation slides for this webinar
Handouts for this webinar
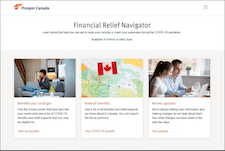
Introducing the Financial Relief Navigator (FRN)
Access the Financial Relief Navigator here.
Time-stamps for the video recording:
3:22 – Agenda and Introductions
6:00 – Audience poll
9:00 – Why we created the Financial Relief Navigator (Speaker: Janet Flynn)
11:55 – What’s in the Financial Relief Navigator (Speaker: Janet Flynn)
16:35 – FRN Walkthrough using a Persona (Speaker: Galen McLusky)
33:15 – Tips for using the FRN (Speaker: Galen McLusky)
36:00 – The Working Centre experience using the FRN (Speaker: Sue Collison)
41:15 – Q&A
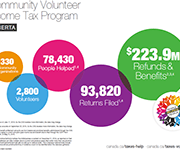
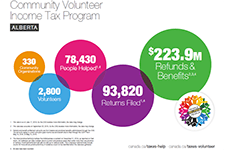
This infographics from the Community Volunteer Income Tax Program (CVITP) show information about the program by province for the tax filing year 2019, including number of returns filed and amount of refunds and benefits accessed. The information is presented in English and French. Les informations sont présentées en anglais et en français.
These reports look at the total incomes available to those relying on social assistance (often called “welfare”), taking into account tax credits and other benefits along with social assistance itself. The reports look at four different household types for each province and territory. Established by the Caledon Institute of Social Policy, Welfare in Canada is a continuation of the Welfare Incomes series originally published by the National Council of Welfare, based on the same approach.
This report examines the financial health and vulnerability of households in Canada’s 35 largest cities, using a new composite index of household financial health at the neighbourhood level, the Neighbourhood Financial Health Index or NFHI. The NFHI is designed to shine a light on the dynamics underlying national trends, taking a closer look at what is happening at the provincial/territorial, community and neighbourhood levels. Update July 22, 2022: Please note that the Neighbourhood Financial Health Index is no longer available
Pour souligner leurs 50 ans d’histoire, les Associations de consommateurs du Québec s’unissent pour offrir à la population québécoise un portail qui rassemble toute une gamme d’informations et d’outils développés au fil des années grâce à leur expertise en finances personnelles. Cette porte d’entrée donne accès à des services spécialisés en finances personnelles offerts par les associations, propose des outils adaptés, et à travers les différentes sections, offre une information claire, objective et critique afin de vous guider vers de meilleurs choix de consommation et une meilleure santé financière.