A labour market snapshot of South Asian, Chinese and Filipino Canadians during the pandemic
The COVID-19 pandemic has highlighted the varying labour market experiences and outcomes of diverse groups of Canadians. To mark Asian Heritage Month, Statistics Canada is providing a profile of the employment characteristics of the three largest Asian populations in Canada: South Asian, Chinese and Filipino Canadians. Results from the Labour Force Survey (LFS) show that South Asian men are much more likely to be employed than South Asian women, that Chinese Canadians have higher average hourly wages than other visible minority groups, and that Filipino women have among the highest employment rates of all groups, with many working on the front line in the health care sector during the pandemic. Unless otherwise stated, all data in this article reflect the population aged 15 to 69 during the three months ending in April 2021, and are not seasonally adjusted.
Labour Force Survey, April 2021
April Labour Force Survey (LFS) data reflect labour market conditions during the week of April 11 to 17.
Non-Profit Organizations and Volunteering Satellite Account: Human Resources Module, 2010 to 2019
In 2019, non-profit organizations (NPOs)—serving households, businesses and governments—employed 2.5 million people, representing 12.8% of all jobs in Canada. The employment share ranged between 12.4% and 12.8%, increasing during the 2010-to-2019 period. While the economic and social landscape of Canada is very different at the time of this release than it was in 2019, these data provide a valuable baseline to better understand the potential impacts of COVID-19 in later reference years.
Employment Insurance, February 2021
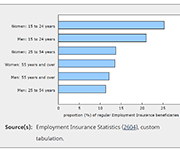
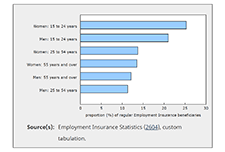
February Employment Insurance (EI) statistics reflect labour market conditions as of the week of February 14 to 20. Ahead of the February reference week, non-essential businesses, cultural and recreation facilities, and in-person dining reopened in many provinces, subject to capacity limits and various other public health requirements. Public health measures were relaxed in Quebec, Alberta, Nova Scotia and New Brunswick on February 8, although a curfew remained in effect in Quebec. Measures were loosened in many regions of Ontario on February 10 and 15, although stay-at-home orders remained in place in the health regions of Toronto, Peel, York and North Bay Parry Sound. In Manitoba, various measures were eased on February 12. In contrast, Newfoundland and Labrador reintroduced a lockdown on February 12, requiring the widespread closure of non-essential businesses and services.
Study: A labour market snapshot of Black Canadians during the pandemic
In the context of the COVID-19 pandemic, many Canadians, including Black Canadians, have experienced significant economic hardship, while others put themselves at risk through their work in essential industries such as health care and social assistance. Statistics Canada looked at how the 1 million Black Canadians aged 15 to 69 are faring in the labour market during one of the most disruptive times in our economic history. Analysis of the recent labour market situation of population groups designated as visible minorities is now possible as a result of a new question added to the Labour Force Survey (LFS) in July 2020. Unless otherwise stated, all data in this release are unadjusted for seasonality and are based on three-month averages ending in January 2021.
Aboriginal Peoples Survey: Data tables, 2017
New data tables on the labour activities of Indigenous Peoples are now available. Data are from the 2017 Aboriginal Peoples Survey and include information on labour force status, job satisfaction, skills training, skills that limit job opportunities, job permanency, part-time or full-time job status, mismatch of skills for current job, disability status and disability severity class, by Indigenous identity, age group and sex. Data are available for Canada, the provinces (Atlantic provinces combined) and the territories.
Aspects of quality of employment in Canada, February and March 2020
The labour market in Canada has experienced unprecedented changes over the last 12 months. Entire sectors of the economy have been subject to temporary restrictions on business activities as a result of public health measures aimed at limiting the spread of COVID-19. At the same time, many workers have seen changes in working conditions, such as teleworking, reduced work hours and greater job insecurity. From mid-February to mid-March 2020, the 2020 Survey on Quality of Employment (SQE) collected information on aspects of job quality in Canada from the perspective of workers. Estimates reflect employment characteristics before the full onset of the COVID-19 pandemic and contribute to establishing a baseline for future analysis of quality of employment in Canada. Unless otherwise stated, the analysis focuses on the 23.5 million workers who were employed in February or March 2020 or who had last worked in 2018 or after, and excludes unpaid family workers.
Labour Force Survey, February 2021
February Labour Force Survey (LFS) data reflect labour market conditions during the week of February 14 to 20. In early February, public health restrictions put in place in late December were eased in many provinces. This allowed for the re-opening of many non-essential businesses, cultural and recreational facilities, and some in-person dining. However, capacity limits and other public health requirements, which varied across jurisdictions, remained in place. Restrictions were eased to varying degrees in Quebec, Alberta, New Brunswick, and Nova Scotia on February 8, although a curfew remained in effect in Quebec. In Ontario, previous requirements were lifted for many regions on February 10 and 15, while the Toronto, Peel, York and North Bay Parry Sound health regions remained under stay-at-home orders through the reference week. Various measures were eased in Manitoba on February 12. In contrast, Newfoundland and Labrador re-introduced a lockdown on February 12, requiring the widespread closure of non-essential businesses and services.
Labour Force Survey, January 2021
After the December Labour Force Survey (LFS) reference week—December 6 to 12—a number of provinces extended public health measures in response to increasing COVID-19 cases. January LFS data reflect the impact of these new restrictions and provide a portrait of labour market conditions as of the week of January 10 to 16. In Ontario, restrictions already in place for many regions of southern Ontario—including the closure of non-essential retail businesses—were extended to the rest of the province effective December 26. In Quebec, non-essential retail businesses were closed effective December 25 and a curfew implemented on January 14 further affected the operating hours of some businesses. As of the January reference week, existing public health measures continued in Alberta and Manitoba, including the closure of in-person dining services, recreation facilities and personal care services, as well as restrictions on retail businesses. Restrictions were eased between the December and January reference weeks in two provinces. In Prince Edward Island, closures of in-person dining and recreational and cultural facilities were lifted on December 18. In Halifax, Nova Scotia, and the surrounding area, restrictions on in-person dining were eased on January 4.
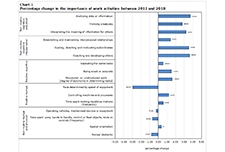
Study: The changing nature of work in Canada amid recent advances in automation technology
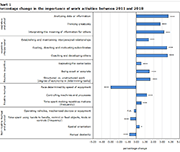
While automation has changed the nature of work in Canada over the past few decades, this change was very gradual, and did not accelerate with the very recent developments in artificial intelligence. The results of this study reveal that the share of Canadians working in managerial, professional and technical occupations increased from 23.8% in 1987 to 31.2% in 2018, while the share employed in service occupations increased more moderately from 19.2% to 21.8% over the same timeframe. Jobs in both of these occupational groups are generally difficult to automate. Meanwhile, the share of workers employed in production, craft, repair and operative occupations (more automatable tasks) went from 29.7% in 1987 to 22.2% in 2018, while the share employed in sales, clerical and administrative support occupations also fell over the period (from 27.3% in 1987 to 24.9% in 2018). These jobs are generally more amenable to automation.
Pandemic to Prosperity – January 21, 2021: One year after the first announcement of Covid on U.S. soil
The National Conference on Citizenship (NCoC) developed the Pandemic to Prosperity series. It builds on NCoC’s data infrastructure and advocacy network developed for its national Civic Health Index, with The New Orleans Index, which informed many public and private decisions and actions post-Katrina. This series is designed to enable a solid understanding of the damage to lives and livelihoods as the pandemic continues to unfold, as the United States enters the era of vaccines, and the nation grapples with new shocks and stressors such as disasters and civil unrest; it will also examine aspirational goals around strong and accountable government, functioning institutions from child care to internet access to local news availability, effective civic participation, and outcomes for people by race regarding employment, health, housing, and more. With each new report in the series, indicators will change as the recovery transitions. This report highlights mostly state-level metrics with breakdowns by race, gender, and age where available, relying on both public and private data sources.
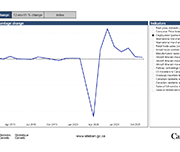
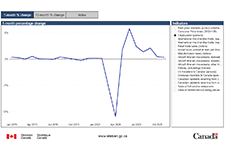
Canadian Economic Dashboard and COVID-19
This dashboard presents selected data that are relevant for monitoring the impacts of COVID-19 on economic activity in Canada. It includes data on a range of monthly indicators - real GDP, consumer prices, the unemployment rate, merchandise exports and imports, retail sales, hours worked and manufacturing sales -- as well as monthly data on aircraft movements, railway carloadings, and travel between Canada and other countries.
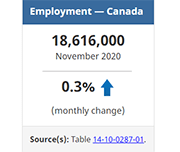
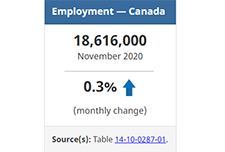
Labour Force Survey, November 2020
November Labour Force Survey (LFS) results reflect labour market conditions as of the week of November 8 to 14. In September and October, many provinces began introducing targeted public health measures in response to rising COVID-19 numbers. In early November, restrictions related to indoor dining and fitness facilities were eased in Ontario, while in Manitoba new measures affecting restaurants, recreational facilities and retail businesses were introduced. Much of Quebec remained at the "red" alert level in November, leading to the ongoing closure of indoor dining and many recreational and cultural facilities.
The long-term labour market integration of refugee claimants who became permanent residents in Canada
Although refugee claimants seek asylum in Canada for humanitarian reasons, their labour market outcomes play a crucial role in their successful integration, which is why it is important to monitor the degree of labour market success achieved by refugee claimants. This study compares the long-term labour market outcomes of refugee claimants who eventually became permanent residents in Canada (RC-PRs) with those of government-assisted refugees (GARs) and privately sponsored refugees (PSRs), as well as with refugee claimants who did not become permanent residents in Canada (RC-NPRs).
Labour Force Survey, October 2020
October Labour Force Survey (LFS) results reflect labour market conditions as of the week of October 11 to 17. By then, several provinces had tightened public health measures in response to a spike in COVID-19 cases. Unlike the widespread economic shutdown implemented in March and April, these measures were targeted at businesses where the risk of COVID transmission is thought to be greater, including indoor restaurants and bars and recreational facilities. Employment increased by 84,000 (+0.5%) in October, after growing by an average of 2.7% per month since May. The unemployment rate was 8.9%, little changed from September. Employment increases in several industries were partially offset by a decrease of 48,000 in the accommodation and food services industry, largely in Quebec.
Labour Force Survey, September 2020
The September Labour Force Survey (LFS) results reflect labour market conditions as of the week of September 13 to 19. At the beginning of September, as Canadian families adapted to new back-to-school routines, public health restrictions had been substantially eased across the country and many businesses and workplaces had re-opened. Throughout the month, some restrictions were re-imposed in response to increases in the number of COVID-19 cases. In British Columbia, new rules and guidelines related to bars and restaurants were implemented on September 8. In Ontario, limits on social gatherings were tightened for the hot spots of Toronto, Peel and Ottawa on September 17 and for the rest of the province on September 19.
Impact of the COVID-19 pandemic on the NEET (not in employment, education or training) indicator, March and April 2020
A fact sheet released by Statistics Canada shows that, in March and April 2020, the proportion of young Canadians who were not in employment, education or training (NEET) increased to unprecedented levels. The COVID-19 pandemic—and the public health interventions that were put in place to limit its spread—have affected young people in a number of ways, including high unemployment rates, school closures and education moving online.
Labour Force Survey, August 2020
The August Labour Force Survey (LFS) results reflect labour market conditions as of the week of August 9 to 15, five months following the onset of the COVID-19 economic shutdown. By mid-August, public health restrictions had substantially eased across the country and more businesses and workplaces had re-opened.
Changes in the socioeconomic situation of Canada’s Black population
This study provides disaggregated statistics on the socioeconomic outcomes of the Black population by generation status (and immigrant status), sex and country of origin, and is intended to illustrate and contribute to the relevance of disaggregation in understanding these populations and the diversity of their situation. This study sheds light on some of the issues faced by the Black population and shows differences that exist compared with the rest of the working-age population, by sex, generation and place of origin, from 2001 to 2016.
U.S. Financial Health Pulse: 2019 Trends Report
This report presents findings from the second annual U.S. Financial Health Pulse, which is designed to explore how the financial health of people in America is changing over time. The annual Pulse report scores survey respondents against eight indicators of financial health -- spending, bill payment, short-term and long-term savings, debt load, credit score, insurance coverage, and planning -- to assess whether they are “financially healthy,” “financially coping,” or “financially vulnerable”. The data in the Pulse report provide critical insights that go beyond aggregate economic indicators, such as employment and market performance, to provide a more accurate picture of the financial lives of people in the U.S.
Labour Force Survey in brief: Interactive app
Part of the Canadian Labour Market Observatory, this interactive data visualization application showcases publicly available labour market information. The fully interactive applications allow Canadians to quickly and easily personalize the information in a way that is relevant to them and their interests.
Infographic: COVID-19 and the labour market in June 2020
This infographic displays information on the Canadian labour market in June 2020 as a result of COVID-19.
Labour Force Survey, June 2020
Labour Force Survey (LFS) results for June reflect labour market conditions as of the week of June 14 to June 20. A series of survey enhancements continued in June, including additional questions on working from home, difficulty meeting financial needs, and receipt of federal COVID-19 assistance payments. New questions were added to measure the extent to which COVID-19-related health risks are being mitigated through workplace adaptations and protective measures.
Infographic: The impact of COVID-19 on the Canadian labour market
This infographic presents information on the impact of COVID-19 on the Canadian labour market, based from the Labour Force Survey conducted each month. Over three million Canadians were affected by job loss or reduced hours.
Does education pay? A comparison of earnings by level of education in Canada and its provinces and territories
This report examines the relationship between the earnings of Canadians in the labour market and their post-secondary education credentials. Findings are based upon information gathered from the 2016 Census on adults between the ages of 25 to 64 with different levels of education and working in different parts of the country.
In sickness and in health: The association between health and household income
This study uses data from the Longitudinal and International Study of Adults (LISA) to analyze the association between health and household income. Using data on both self-reported general health and self-report mental health, as well as self-reported labour-market outcomes and linked tax records, the association between spouse-pair labour-market income and health is further decomposed into an employment effect reflecting the association between health and the probability of employment, an hours worked effect reflecting the association between health and the number of hours worked, and a wage effect reflecting
the association between health and hourly wages.
Earnings Inequality and the Gender Pay Gap in Canada
This study from Statistics Canada explores how increases in top earnings and the representation of women among top earners affect the overall gender earnings gap in Canada. Results show that even though the representation of women in top earnings groups increased from 1978 to 2015, their continued under-representation in these groups accounted for a substantial and growing share of the gender gap in total annual earnings.
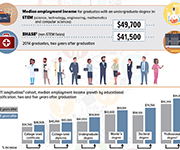
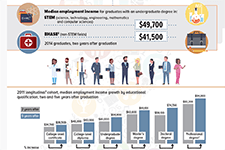
Infographic: Labour market outcomes for college and university graduates, 2010 to 2014
This infographic from Statistics Canada shows the labour market outcomes for college and university graduates between 2010 and 2014. It shows the median employment income achieved by graduates of different education levels, 2 years and 5 years post-graduation. Overall, it shows that people with higher levels of post-secondary education report higher employment income post-graduation.
Boosting the Earned Income Tax Credit for Singles
By providing a refundable credit at tax time, the Earned Income Tax Credit (EITC) is widely viewed as a successful public policy that is both antipoverty and pro-work. But most of its benefits have gone to workers with children. Paycheck Plus is a test of a more generous credit for low-income workers without dependent children. The program, which provides a bonus of up to $2,000 at tax time, is being evaluated using a randomized controlled trial in New York City and Atlanta. This report presents findings through three years from New York, where over 6,000 low-income single adults without dependent children enrolled in the study in late 2013. The findings are consistent with other research on the federal EITC, indicating that an effective work-based safety net program can increase incomes for vulnerable and low-income individuals and families while encouraging and rewarding work.
Income volatility: What banking data can tell us, if we ask
In this video presentation Fiona Greig from the JP Morgan Chase Institute explains what banking data can tell us about income volatility in the United States. This presentation was given at the Prosper Canada Policy Research Symposium on March 9, 2018. Read the slide deck that accompanies this presentation. Pour lire les diapositives de la présentation, cliquez ici. View the full video playlist of all presentations from this symposium.


