Discover financial empowerment resources
Discover financial empowerment resources
The Government of Canada has created a digital toolkit for Black History Month 2025. Click on "Access this resource" to download a Black History month poster, a virtual background for video...

An infographic highlighting how to attend post-secondary education with no student debt. It shows how a family eligible for the Canada Learning Bond, with average family savings, student earnings and available grants can cover the cost of post-secondary education (PSE) with no need to...
This is an infographic on the Adaptive Prosperity framework developed by the Indiana Association for Community Economic Development. This is a collaborative vision of empowerment and assets focused on all parts of a...
This is an infographic showing the results of a 2016 survey by the Council of Ontario Universities. The survey shows the employment rates of University graduates 6 months and 2 years after...
Moving to a new country is exciting, but there's no denying that it comes with its own unique set of challenges. This infographic shows results from the Money Talk For Newcomers Poll by TD Canada...
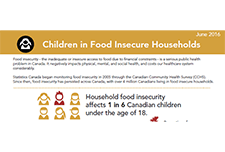
This is an infographic summarizing Canadian Community Health Survey data on food insecurity. V=Food insecurity - the inadequate or insecure access to food due to financial constraints - is a serious public health problem in Canada. It negatively impacts physical, mental, and social health, and...

This infographic explains the impact of food insecurity on health in Canada. Food insecurity - the inadequate or insecure access to food due to financial constraints - negatively impacts physical, mental, and social health, and costs our healthcare system...
This is a graphic and brief from the PROOF research group. Food insecurity - the inadequate or insecure access to food due to financial constraints - is a serious public health problem in Canada. It negatively impacts physical, mental, and social...
This is a brief and infographic on policy recommendations relating to food insecurity in Canada. Food insecurity is rooted in material deprivation, with low income being the strongest predictor. Research has demonstrated reductions in food insecurity where social policies have improved the material...
The poorer you are, the more likely you are to have worse health, to receive worse health care and to die earlier. A report by Health Quality Ontario, Income and Health reveals significant differences in people’s health risks, care and outcomes based on income. Below is a snapshot of the...
To better grasp the financial issues faced by older Canadians in and approaching retirement, the Ontario Securities Commission (OSC) commissioned a survey1 of 1,500 people age 50 and older. Through the survey, the OSC discovered 3 key lessons that respondents wish they had better understood and...
Against the backdrop of decreasing savings and increasing debt, a recent Investor Education Fund survey explored the consequences of inaction and a household savings crisis, 20 years in the making. Uses data from 2012, publication date...
This chart presents a household financial security framework. The framework summarizes the ideal placement of financial wellness interventions in the stages learn, earn, save, invest, and...
This is an infographic summarizing the financial situation of Americans captured in the National Financial Capability Study (NFCS) in 2015. The study shows evidence that the financial circumstances of Americans have improved over the last several years. Americans are finding it easier to pay...
Infographic. Against the backdrop of rising post-secondary debt, a recent Investor Education Fund study explored early contributing factors among Ontario high school students aged 14 –...
In an effort to better understand girls’ level of financial literacy and their confidence, attitudes, and experiences with regard to money, the Girl Scout Research Institute conducted a survey with a nationwide sample of over 1,000 girls ages 8–17 and their parents.* This study reveals...
More than half of Americans in the tenuous segment live paycheck to paycheck (53%) and struggle to keep up with bills and credit payments. Yet the majority receive regular wages and predictable income. In many ways, individuals in the tenuous segment resemble those in the striving segment, though...
Over 29 million Americans comprise the “at risk” segment – most likely of all the segments to live paycheck to paycheck and run out of money before the end of the month. Seven in ten struggle to keep on top of their bills, and a quarter are actually falling behind on credit and bill...
Strivers are generally able to make ends meet, but many of them are not satisfied with their current financial situation and are working to better their financial circumstances. This segment differentiates itself by its unusually high rate of planning for irregular expenses, according to the...
According to the Center for Financial Services Innovation’s 2014 study on consumer financial health, a whopping sixteen percent of the country is unengaged with their financial situation. This segment earns its name from these consumers’ lack of awareness about their financial lives and their...
To paint a picture of how financial capability develops, the CFED has looked at three types of lifecycle events: Universal experiences: things that happen to everyone, like early childhood and middle school; Expected or recurring experiences: things that happen for most of us, but at different...
