


The Social Assistance Summaries series tracks the number of recipients of social assistance (welfare payments) in each province and territory. It was established by the Caledon Institute of Social Policy to maintain data previously published by the federal government as the Social Assistance Statistical Report. The data is provided by provincial and territorial government officials.

This report summarizes the information gathered by the Consumer Financial Protection Bureau (CFPB) regarding certain consumer complaints transmitted by the CFPB to the three largest nationwide consumer reporting agencies - Equifax, Experian and TransUnion.

In September – October 2020, the Trans PULSE Canada study team conducted the COVID Cohort to assess the social, economic, and health impacts of the COVID-19 pandemic on trans and non-binary people in Canada. This dashboard serves as an interactive tool for community members and researchers to explore key findings from the Trans PULSE Canada COVID survey, and to break down the results by one or more socio-demographic characteristics. The proportions in the dashboard are weighted to represent the 2019 Trans PULSE Canada sample.
The Toronto Central Local Health Integration Network (Toronto Central LHIN) provided financial support to establish the Measuring Health Equity Project and has called for recommendations on health equity data use and a sustainability approach for future data collection. This report describes the journey Toronto Central LHIN and Sinai Health System have taken to embed demographic data collection in hospitals and Community Health Centres. It also summarizes the potential impact of embedding demographic data collection into Ontario health-care delivery and planning. And finally, it describes the use of this data, the lessons learned, and provides recommendations for moving forward.

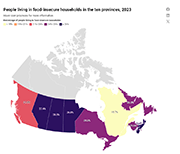
Low income measure (LIM) thresholds by household size for market income, total income and after-tax income, in current and constant dollars, annual.
Practitioners engaged in the nascent field of financial development lack a shared system of tracking and analyzing customer progress toward financial security. Practice leaders—ranging from direct service organizations such as the Chicago-based LISC to NeighborWorks America of Washington, D.C.—define customer progress by their individual outcomes frameworks. But without uniform outcomes measures to assess our customers’ progress—and thus, our own performance—the field as a whole is handicapped. Many factors contribute to this problem, two being most prominent: organizations are grounded in distinct theories of change, are funded by a variety of sources with their own expectations, and lack of clarity about how to measure aspects of our work.
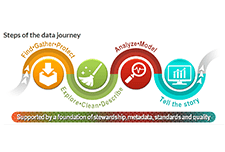
Statistics Canada presents a learning catalogue to share knowledge on data literacy. Data literacy is the ability to derive meaningful information from data. It focuses on the competencies involved in working with data including the knowledge and skills to read, analyze, interpret, visualize and communicate data as well as understand the use of data in decision-making. Their aim is to provide learners with information on the basic concepts and skills with regard to a range of data literacy topics. The training is aimed at those who are new to data or those who have some experience with data but may need a refresher or want to expand their knowledge.
The Pandemic Response and Recovery Toolkit is intended to assist System Leaders plan and navigate the next steps in their community’s response and recovery as it pertains to people experiencing homelessness and people supported in housing programs. The Toolkit outlines phases and action steps – many that have yet to be mobilized - to help with planning, implementation and evaluation of pandemic response and recovery activities in communities. Furthermore, it contains a compendium of resources to help System Leaders along the way. This could be a time of doom and gloom. But there is a silver lining. With innovation and the courage to capitalize on emerging opportunities, the homelessness response and housing support system may emerge from this situation stronger and better than before the pandemic hit. It is possible that we can achieve Recovery for All.


This report responds to a call made by APEC Finance Ministers at their 23rd Ministerial Meeting in Lima in 2016 to advance “the design and implementation of financial literacy policies building on the expertise and standards developed by the OECD International Network on Financial Education”. The findings illustrate that the majority of APEC economies are well-advanced in their efforts to collect relevant data, implement appropriate financial education policies, and address the remaining issues related to financial literacy, inclusion and consumer
protection. They are applying international best practices and making good use of available tools and resources to develop and refine strategic approaches and specific initiatives. However, there is still some way to go in ensuring that everyone living in an APEC
economy has the financial literacy that they need and concerns about financial fraud or abuse, the high complexity of financial services and the low financial literacy of specific population groups are driving policy interest in improving financial education.

Different from common perception, many disabilities do not follow a stable pattern. Persons with disabilities may experience periods of good health in between periods of their limitations and/or experience changes in the severity of their limitations over time. These types of disabilities may be characterized as dynamic because the very nature of the disability is one of change with different possible trajectories over time. As a consequence, the collective experiences of those with disability dynamics are likely to be different than those with so-called “continuous” disabilities. In this paper, four groups of persons with different disability dynamics (or lack of dynamics) are profiled based on data from the 2017 Canadian Survey on Disability. Each group has their own unique demographic, employment, and workplace accommodation profile based on the length of time between periods of their limitations, as well as changes in their limitations over time.


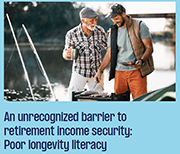
This is a study released by Insights on Canadian Society based on 2016 Census data. Census information on immigration and income is used to better understand the factors associated with low income among senior immigrants. This study examines the factors associated with the low-income rate of senior immigrants, with a focus on access to Old Age Security (OAS) and Guaranteed Income Supplement (GIS) benefits.

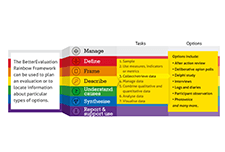
The Rainbow Framework organizes different methods and processes that can be used in monitoring and evaluation. The range of tasks are organised into seven colour-coded clusters: Manage, Define, Frame, Describe, Understand Causes, Synthesise, and Report & Support Use. Users can use the framework to plan an evaluation that covers all necessary tasks or choose from an approach which contains a pre-packaged combination of task options.
Bank On coalitions are locally-led partnerships between local public officials; city, state, and federal government agencies; financial institutions; and community organizations that work together to help improve the financial stability of unbanked and underbanked individuals and families in their communities. The CFE Fund’s Bank On national initiative builds on this grassroots movement, supporting local coalitions with strategic and financial support, as well as by liaising nationally with banking, regulatory, and nonprofit organization partners to expand banking access. This tool details the 2017 Bank On Data Pilot and includes instructions for accessing the local Bank On data at the city and zip code level.
This brief describes the data collected and lessons gleaned from the Financial Coaching Impact & Evaluation Fellowship, which took place over the course of 10 months in 2017. Ultimately, this brief argues that the Financial Well-Being Scale and the Financial Capability Scale are promising tools for financial capability programs seeking to understand the impact of their programs.

The Center for Financial Security (CFS) and Annie E. Casey Foundation have developed a short set of standardized client outcome measures to create the Financial Capability Scale (FCS). In 2011, CFS worked with four organizations to collect data on client outcome measures, with the goal of refining a small set of measures that can be used across programs. The project aimed to increase coordination across organizations so the financial coaching field can improve its capacity to demonstrate client impacts. The findings from the project extend beyond the coaching field and can be applied to other financial capability services.