Income in retirement: Expectations versus reality
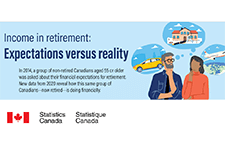
In 2014, a group of non-retired Canadians aged 55 or older was asked about their financial expectations for retirement. New data from 2020 reveal how this same group of Canadians - now retired- is doing financially.
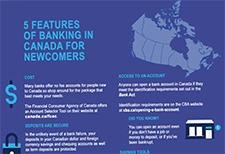
Banking for newcomers to Canada
Banks offer extensive information on how newcomers to Canada can get started in their new country, including checklists, information, financial services and advice. Here is some basic information to get you started. A list of bank resources at the end of this article may also help with the financial transition to Canada.
Sustainable Development Goals: Goal 10, Reduced Inequalities
An infographic from Statistics Canada highlighting the advances made in reaching Goal 10, reducing inequalities, of the sustainable development goals.
Cyber security checklist
Getting cyber safe doesn't have to be complicated. With the right resources and tools, you can stay safe and secure online. Here's a handy checklist for protecting your data online.
Economic Abuse: Coercive Control Tactics in Intimate Relationships
This infographic explores 3 forms of economic abuse and associated tactics used to coercively control intimate partners. These abusive tactics are compounded by economic systems that systemically oppress groups including Black, Indigenous, and people of colour; people with disabilities; people with precarious immigration status; and gender-oppressed people. Economic abuse consists of behaviours to control, exploit, and sabotage an individual’s resources. It limits the individual’s independence and autonomy. Compared to financial abuse which usually only focuses on money, economic abuse includes a more expansive range of behaviour that affects things like employment, food, medicine, and housing. Economic abuse is often used to coercively control individuals, such as intimate partners. It occurs in conjunction with further forms of abuse, like physical and sexual violence. Economic abuse can make it more difficult for survivors to escape violence since they may not have the resources to secure long-term housing and employment while meeting basic needs for themselves and potentially their children.
FCAC new consumer information – electronic alerts
Le français suit l’anglais. As of June 30, 2022, banks will be required to send electronic alerts to their customers to help them manage their finances and avoid unnecessary fees. Some banks have already started sending these alerts to their customers. The electronic alerts are part of the new and enhanced protections in Canada’s Financial Consumer Protection Framework (the Framework) that comes into effect on June 30, 2022. To inform Canadians about electronic alerts and their benefits, the Financial Consumer Agency of Canada (FCAC) published new consumer information on electronic alerts, developed an infographic, and prepared social media content that you can use on your own social media channels. Under the Framework, banks will be required to: À compter du 30 juin 2022, les banques seront tenues d’envoyer des alertes électroniques à leurs clients afin de les aider à gérer leurs finances et à éviter de payer inutilement des frais, ce que certaines ont déjà commencé à faire. Ces alertes font partie des mesures de protection nouvelles ou améliorées prévues dans le Cadre de protection des consommateurs de produits et services financiers du Canada (le Cadre) qui entre en vigueur le 30 juin 2022. Pour informer les Canadiens et les Canadiennes à propos des alertes électroniques et de leurs avantages, l’Agence de la consommation en matière financière du Canada (ACFC) a publié de nouveaux renseignements à ce sujet pour les consommateurs. Elle a également créé une infographie et préparé du contenu pour les réseaux sociaux que vous pouvez utiliser dans vos propres comptes de médias sociaux. En vertu des dispositions du Cadre, les banques seront tenues :
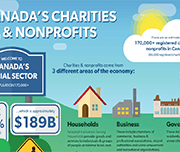
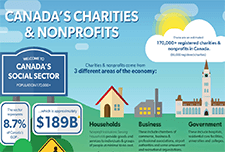
Canada’s Charities & Nonprofits
This infographic shows the size, scope, and economic contribution of charities and nonprofits across Canada.
Emerging Technology for All: Conversational AI’s Pivotal Role
This infographic is a preview of Commonwealth's research survey of 1290 lower-and moderate-income people to understand their perceptions, needs, and uses of conversational AI.
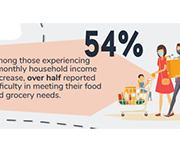
How are Canadians with long-term conditions and disabilities impacted by the COVID-19 pandemic?
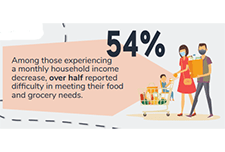
This infographic focuses on self-reported health, unmet needs for services and therapies, and difficulties meeting certain financial obligations and essential needs since the start of the COVID-19 pandemic among participants aged 15 and older living with long-term conditions and disabilities. Results are based on the recent Statistics Canada crowdsourcing data collection completed by over 13,000 Canadians with long-term conditions or disabilities between June 23 and July 6, 2020.
Growing up in a lower-income family can have lasting effects
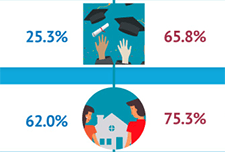
The infographic "Intergenerational income mobility: The lasting effects of growing up in a lower-income family" based on the article "Exploration of the role of education in intergenerational income mobility in Canada: Evidence from the Longitudinal and International Study of Adults," published in the Canadian Public Policy journal presents the effects of growing up in a lower-income family based on a longitudinal study of a cohort of Canadians born between 1963 and 1979.
Infographic: COVID-19 and the labour market in June 2020
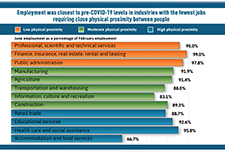
This infographic displays information on the Canadian labour market in June 2020 as a result of COVID-19.
Infographic: The impact of the COVID-19 pandemic on Canadian families and children
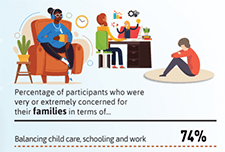
This infographic describes parents' experiences during the COVID-19 pandemic including balancing work and schooling, their children's activities and parents' concerns.
Infographic: An overview of Canadian financial programs for people with disabilities
One in five Canadians are currently living with a disability. This infographic provides an overview of financial programs for people with disabilities in Canada based on findings in Morris et al. (2018) "A demographic, employment and income profile of Canadians with disabilities aged 15 years and over, 2017".
Virtual tax filing: Piloting a new way to file taxes for homebound seniors
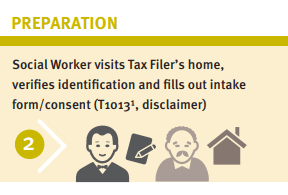
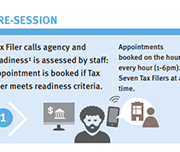
WoodGreen Community Services, a large multi-service frontline social service agency in Toronto, provides free tax preparation services year-round to people living on low incomes. WoodGreen was interested in designing a novel solution to address the tax filing needs of homebound seniors who are unable to access WoodGreen’s free in-person tax-preparation services due to physical or mental health challenges. Specifically, WoodGreen wanted to know… How might we provide high-quality professional tax preparation services to all clients whether or not they are onsite? Prosper Canada and a leading commercial tax preparation software company partnered with WoodGreen Community Services in order to answer this design question.
English
Supported self-file process maps: English
French
Infographic: The impact of COVID-19 on the Canadian labour market
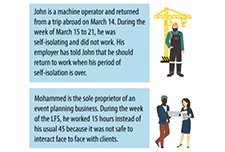
This infographic presents information on the impact of COVID-19 on the Canadian labour market, based from the Labour Force Survey conducted each month. Over three million Canadians were affected by job loss or reduced hours.
Infographic: How are Canadians coping with the COVID-19 situation?
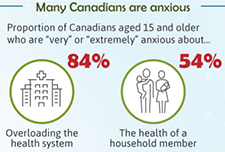
An infographic on the findings from a web panel online survey conducted by Statistics Canada between March 29 and April 3 on how Canadians are responding to the COVID-19 situation. A summary of how many Canadians are feeling anxious, what they are doing during the crisis, and the main precautions that they are taking are presented.
Community Volunteer Income Tax Program (CVITP) provincial snapshots
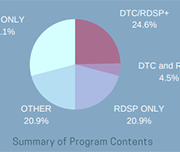
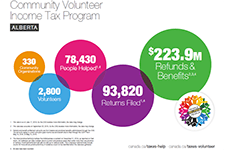
This infographics from the Community Volunteer Income Tax Program (CVITP) show information about the program by province for the tax filing year 2019, including number of returns filed and amount of refunds and benefits accessed. The information is presented in English and French. Les informations sont présentées en anglais et en français.
Infographic: Avoid financial stress, save for emergencies
This infographic illustrates the importance of having an emergency fund and how to build one.
Financial Empowerment for Newcomers infographic
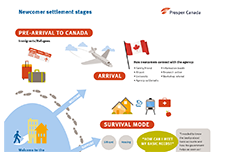
This infographic displays data gathered from interviewing 53 newcomer participants in three provinces (Saskatchewan, Ontario, and Newfoundland) between August and October 2017. Learn more about the stages of newcomer settlement, key money topics and experiences of newcomers, and three types of newcomer client personas.
Infographic: The Changing Characteristics of Canadian Jobs
This infographic released by Statistics Canada shows some of the ways the Canadian workforce has changed from 1981 to 2018. Some of these changes include industry, pension coverage, whether jobs are full-time and permanent, and whether they are unionized. These changes have also not been uniform for men and women.
Infographic: New Data on Disability in Canada, 2017
This infographic released from Statistics Canada compiles some of the data collected from the 2017 Canadian Survey on Disability. 22% of Canadians had at least one disability, representing 6.2 million people.
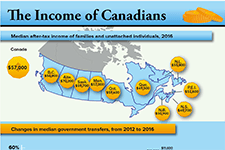
The income of Canadians
This infographic from Statistics Canada shows the median after-tax income of households, by province, as of 2016. It also shows changes in median government transfers, and number of people living on low incomes according to the after-tax low income measure.
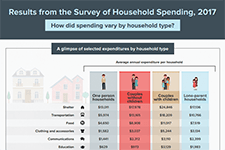
Results from the Survey of Household Spending, 2017 (Infographic)
This infographic from Statistics Canada summarizes the results of the Survey of Household Spending, 2017, including average annual expenditures by household type.
Infographic: Labour market outcomes for college and university graduates, 2010 to 2014
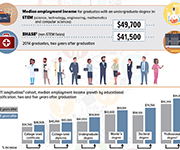
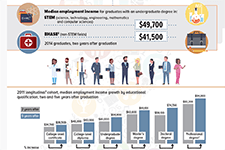
This infographic from Statistics Canada shows the labour market outcomes for college and university graduates between 2010 and 2014. It shows the median employment income achieved by graduates of different education levels, 2 years and 5 years post-graduation. Overall, it shows that people with higher levels of post-secondary education report higher employment income post-graduation.
Infographic: Canadian Payroll Association’s 2018 Survey of Employees
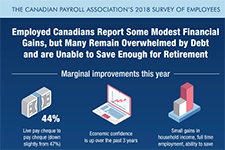
This infographic shows results from the 2018 Survey of Employees conducted by the Canadian Payroll Association. It shows some marginal improvements but also some concerns. 44% of Canadians are living paycheque to paycheque, 40% feel overwhelmed by debt, and 72% have saved only one quarter or less of what they feel they'll need to retire. View full suite of news release and infographics from this survey, by province.
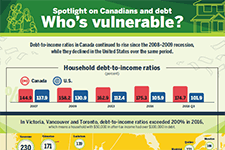
Spotlight on Canadians and Debt: Who’s Vulnerable
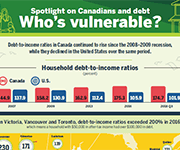
Debt-to-income ratios in Canada have continue to rise since the 2008-2009 recession, especially in urban centres where housing prices have increased over the last few years. This infographic from Statistics Canada shows where debt-to-income ratios are highest across Canada.
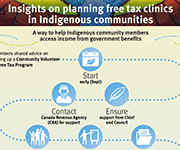
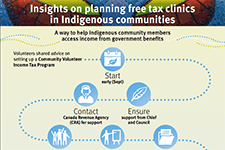
Insights on planning free tax clinics in Indigenous communities
This infographic by Prosper Canada features advice to help Indigenous communities and organizations set up free income tax clinics. Advice was shared by clinic volunteers through a roundtable and interviews as part of the First Nations Financial Wellness project.
SmartSAVER: Canada Learning Bond Infographic
An infographic highlighting how to attend post-secondary education with no student debt. It shows how a family eligible for the Canada Learning Bond, with average family savings, student earnings and available grants can cover the cost of post-secondary education (PSE) with no need to borrow.
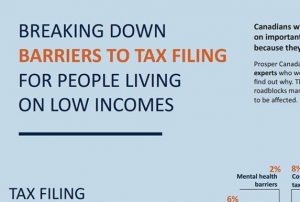
Breaking down barriers to tax filing for people living on low incomes – Infographic
This infographic by Prosper Canada summarizes the barriers to filing taxes faced by people living on low incomes. These barriers include access challenges, fear, lower literacy, and other challenges.


