Welfare in Canada, 2020
Maytree released the 2020 edition of the Welfare in Canada report. For each province and territory, this report provides data and analysis on the total welfare income that households receiving social assistance would have qualified for in 2020, including COVID-19 pandemic-related supports. Welfare in Canada is a series that presents the total incomes of four example households who qualify for social assistance benefits in each of Canada’s provinces and territories in a given year. Welfare in Canada, 2020 looks at the maximum total amount that a household would have received over the course of the 2020 calendar year, assuming they had no other source of income and no assets. Some households may have received less if they had income from other sources, while some households may have received more if they had special health- or disability-related needs. The report looks at: In addition, this year the report includes a new section that looks at the adequacy of welfare incomes in each province over time, an analysis that hearkens back to past reports prepared by the National Council of Welfare. Also, please note that this report measures the adequacy of welfare incomes relative to both the Market Basket Measure (MBM) – Canada’s Official Poverty Line – and the Deep Income Poverty threshold (MBM-DIP), which is equivalent to 75 per cent of the MBM. This analysis will replace the low-income threshold comparisons in future reports. We hope these additions will be helpful for those using the report. In each jurisdiction, the total welfare income for which a household is eligible depends on its specific composition. For illustrative purposes, this resource focuses on the welfare incomes of four example household types:
San’yas Indigenous Cultural Safety Training
Cultural safety is about fostering a climate where the unique history of Indigenous peoples is recognized and respected in order to provide appropriate care and services in an equitable and safe way, without discrimination. This website includes information about the San’yas: Indigenous Cultural Safety Training Program delivered by the Provincial Health Services Authority of British Columbia.
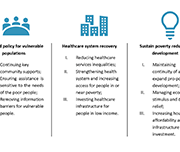
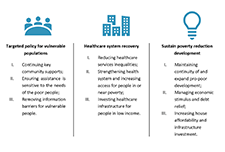
The relationship between COVID-19 pandemic and people in poverty: Exploring the impact scale and potential policy responses
This research project aims to identify the relationship between COVID-19 pandemic and poverty in Vancouver, by analyzing how the COVID-19 pandemic has pushed people into poverty and the impact of COVID-19 on people already living in poverty. Several examples of COVID-19 recovery policies and projects being implemented elsewhere that could support people experiencing poverty in Vancouver are also provided.
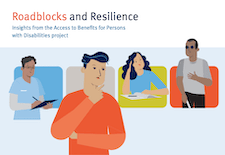
Roadblocks and Resilience
This report, Roadblocks and Resilience Insights from the Access to Benefits for Persons with Disabilities project, provides insights on the barriers people with disabilities in British Columbia face in accessing key income benefits. These insights, and the accompanying service principles that participants identified, were obtained by reviewing existing research, directly engaging 16 B.C. residents with disabilities and interviewing 18 researchers and service providers across Canada. We will use these insights to inform development and testing of a pilot service to support people with disabilities to access disability benefits. The related journey map Common steps to get disability benefits also illustrates the complexities of this benefits application process. This journey map illustrates the process of applying for the Disability Tax Credit. The journey map Persons with Disability (PWD) status illustrates the process of preparing for and applying for and maintaining Persons with Disabilities Status and disability assistance in B.C.
Together BC: British Columbia’s Poverty Reduction Strategy
British Columbia’s Poverty Reduction Strategy, sets a path to reduce overall poverty in B.C. by 25% and child poverty by 50% by 2024. With investments from across Government, TogetherBC reflects government’s commitment to reduce poverty and make life more affordable for British Columbians. It includes policy initiatives and investments designed to lift people up, break the cycle of poverty and build a better B.C. for everyone. Built on the principles of Affordability, Opportunity, Reconciliation, and Social Inclusion, TogetherBC focuses on six priority action areas:
Office of the Superintendent of Bankruptcy Canada: Statistics and Research
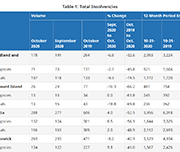
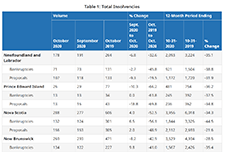
The Office of the Superintendent of Bankruptcy Canada releases statistics on insolvency (bankruptcies and proposals) numbers in Canada. The latest statistics released on November 4, 2020 show that the number of insolvencies in Canada increased in the third quarter of 2020 by 7.9% compared to the second quarter.
Disability Alliance BC
Disability Alliance BC supports people in British Columbia with disabilities through direct services, community partnerships, advocacy, research and publications. Their website provides information on disability benefits including the Disability Tax Credit (DTC), CPP Disability, Registered Disability Savings Plans (RDSP) and more.
Impact of the COVID-19 pandemic on the NEET (not in employment, education or training) indicator, March and April 2020
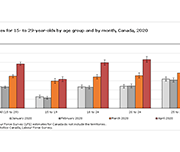
A fact sheet released by Statistics Canada shows that, in March and April 2020, the proportion of young Canadians who were not in employment, education or training (NEET) increased to unprecedented levels. The COVID-19 pandemic—and the public health interventions that were put in place to limit its spread—have affected young people in a number of ways, including high unemployment rates, school closures and education moving online.
Social Assistance Summaries
The Social Assistance Summaries series tracks the number of recipients of social assistance (welfare payments) in each province and territory. It was established by the Caledon Institute of Social Policy to maintain data previously published by the federal government as the Social Assistance Statistical Report. The data is provided by provincial and territorial government officials.
Are charities ready for social finance? Investment readiness in Canada’s charitable sector
While social finance could have a transformative impact on the funding and financial landscape, relatively little is understood about its implications for charities. This webinar presents the results of a national survey of over 1,000 registered charities undertaken by Imagine Canada to better understand charities’ current readiness to participate in Canada’s growing social finance market
Resources
Handouts, slides, and time-stamps
Presentation slides for this webinar
Handouts for this webinar
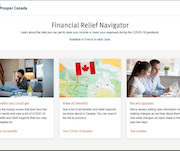
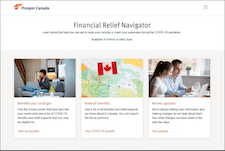
Introducing the Financial Relief Navigator (FRN)
Access the Financial Relief Navigator here.
Time-stamps for the video recording:
3:22 – Agenda and Introductions
6:00 – Audience poll
9:00 – Why we created the Financial Relief Navigator (Speaker: Janet Flynn)
11:55 – What’s in the Financial Relief Navigator (Speaker: Janet Flynn)
16:35 – FRN Walkthrough using a Persona (Speaker: Galen McLusky)
33:15 – Tips for using the FRN (Speaker: Galen McLusky)
36:00 – The Working Centre experience using the FRN (Speaker: Sue Collison)
41:15 – Q&A
Community Volunteer Income Tax Program (CVITP) provincial snapshots
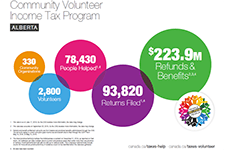
This infographics from the Community Volunteer Income Tax Program (CVITP) show information about the program by province for the tax filing year 2019, including number of returns filed and amount of refunds and benefits accessed. The information is presented in English and French. Les informations sont présentées en anglais et en français.
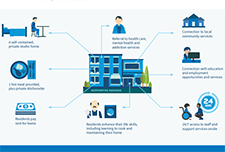
Community Benefits of Supportive Housing
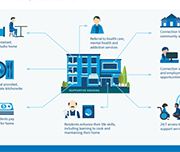
This report highlights mostly B.C.-based research and includes key information, facts, and statistics to answer common questions that neighbours, local government, and other stakeholders may have about supportive housing. The easy-to-read question and answer format also includes infographics to showcase the benefits of supportive housing in neighbourhoods across British Columbia and beyond.
Comparison of Provincial and Territorial Child Benefits and Recommendations for British Columbia
First Call BC Child and Youth Advocacy Coalition has been tracking child and family poverty rates in BC for more than two decades. Every November, with the support of the Social Planning and Research Council of BC (SPARC BC), a report card is released with the latest statistics on child and family poverty in BC and recommendations for policy changes that would reduce these poverty levels. This report presents data from the latest report card released by First Call on a cross-Canada comparison of child benefits.
Welfare in Canada, 2018
These reports look at the total incomes available to those relying on social assistance (often called “welfare”), taking into account tax credits and other benefits along with social assistance itself. The reports look at four different household types for each province and territory. Established by the Caledon Institute of Social Policy, Welfare in Canada is a continuation of the Welfare Incomes series originally published by the National Council of Welfare, based on the same approach.
Urban Spotlight: Neighbourhood Financial Health Index findings for Canada’s cities
This report examines the financial health and vulnerability of households in Canada’s 35 largest cities, using a new composite index of household financial health at the neighbourhood level, the Neighbourhood Financial Health Index or NFHI. The NFHI is designed to shine a light on the dynamics underlying national trends, taking a closer look at what is happening at the provincial/territorial, community and neighbourhood levels. Update July 22, 2022: Please note that the Neighbourhood Financial Health Index is no longer available
