More Canadians are finding it difficult to meet food, shelter and other necessary expenses
In 2022, the Consumer Price Index rose 6.8%, the highest increase since 1982 (+10.9%). Prices for day-to-day goods and services such as transportation (+10.6%), food (+8.9%) and shelter (+6.9%) rose the most. Canadians felt the impact of rising prices. Data from the Canadian Social Survey (CSS) show that the share of persons aged 15 and older living in a household experiencing difficulty meeting its necessary expenses trended upward from just under one-fifth (19%) in the summer of 2021 to just under one-quarter (24%) in the summer of 2022. By the end of 2022, more than one-third (35%) of the population lived in such a household.
Household economic well-being during the COVID-19 pandemic, experimental estimates, fourth quarter 2020
A highlight of some of the findings reported in this briefing:
Cross Canada Check-up (updated March 2021)
Canada ranks consistently as one of the best places to live in the world and one of the wealthiest. When it comes to looking at the financial health of Canadian households, however, we are often forced to rely on incomplete measures, like income alone, or aggregate national statistics that tell us little about the distribution of financial health and vulnerability in our neighbourhoods, communities or provinces/territories. The purpose of this report is to examine the financial heath and vulnerability of Canadian households in different provinces and territories using a new composite index of household financial health, the Neighbourhood Financial Health Index or NFHI.
State of Fair Banking in Canada 2020: Borrower and Lender Perspectives
The DUCA Impact Lab defines fair banking as any financial product or service that lives up to the following set of principles: Their Fair Banking 2020 report presents data on the following areas:
Attitudes Toward Debt and Debt Behavior
This paper introduces a novel survey measure of attitude toward debt. Survey results with panel data on Swedish household balance sheets from registry data are matched, showing that debt attitude measure helps explain individual variation in indebtedness as well as debt build-up and spending behavior in the period 2004–2007. As an explanatory variable, debt attitude compares well to a number of other determinants of debt, including education, risk-taking, and financial literacy. Evidence that suggests that debt attitude is passed down along family lines and has a cultural element is also presented.
Resources
Handouts, slides, and time-stamps
Read the presentation slides for this webinar.
Handouts for this webinar:
Report: Roadblock to recovery: Consumer debt of low- and moderate-income Canadian households in the time of COVID-19 (Prosper Canada)
Survey results: Canadians with incomes under $40K bearing the financial brunt of COVID-19 (Leger and Prosper Canada)
Time-stamps for the video recording:
4:42 – Agenda and introductions
7:52 – Audience polls
10:55 – Researching consumer debt (Speaker: Alex Bucik)
18:55 – How much does debt cost? (Speaker: Alex Bucik)
23:17 – How do different kinds of debt work? (Speaker: Alex Bucik)
29:17 – What are people using their credit for? (Speaker: Vivian Odu)
40:49 – What help is available to Canadian borrowers? (Speaker: Alex Bucik)
45:22 – Q&A
Roadblock to Recovery: Consumer debt of low- and moderate-income Canadians in the time of COVID-19
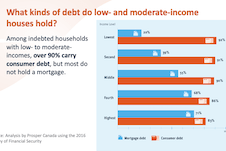
Almost half of low-income households and 62 per cent of moderate-income households carry debt, with households on low incomes spending 31 per cent of their income on debt repayments, according to a new report published by national charity, Prosper Canada.
This report analyzes the distribution, amount and composition of non-mortgage debt held by low- and moderate-income Canadian households and explores implications for federal and provincial/territorial policy makers as they develop and implement COVID-19 economic recovery plans and fulfill their respective regulatory roles.
Lifting the Weight: Consumer Debt Solutions Framework
Aspen Financial Security Program’s the Expanding Prosperity Impact Collaborative (EPIC) has identified seven specific consumer debt problems that result in decreased financial insecurity and well-being. Four of the identified problems are general to consumer debt: households’ lack of savings or financial cushion, restricted access to existing high-quality credit for specific groups of consumers, exposure to harmful loan terms and features, and detrimental delinquency, default, and collections practices. The other three problems relate to structural features of three specific types of debt: student loans, medical debt, and government fines and fees. This report presents a solutions framework to address all seven of these problems. The framework includes setting one or more tangible goals to achieve for each problem, and, for each goal, the solutions different sectors (financial services providers, governments, non-profits, employers, educational or medical institutions) can pursue.
How Are the Most Vulnerable Households Navigating the Financial Impact of COVID-19?
The COVID-19 pandemic has already had an unprecedented impact on the financial lives of households across the United States. During June and July 2020, Prosperity Now conducted a national survey of lower-income households to better understand the circumstances these households are confronted with and the strategies they use to secure resources to navigate this crisis.
U.S. Financial Health Pulse: 2019 Trends Report
This report presents findings from the second annual U.S. Financial Health Pulse, which is designed to explore how the financial health of people in America is changing over time. The annual Pulse report scores survey respondents against eight indicators of financial health -- spending, bill payment, short-term and long-term savings, debt load, credit score, insurance coverage, and planning -- to assess whether they are “financially healthy,” “financially coping,” or “financially vulnerable”. The data in the Pulse report provide critical insights that go beyond aggregate economic indicators, such as employment and market performance, to provide a more accurate picture of the financial lives of people in the U.S.
Financial well-being in America
This report provides a view into the state of financial well-being in America. It presents results from the National Financial Well-Being Survey, conducted in late 2016. The findings include the distribution of financial well-being scores for the overall adult population and for selected subgroups, which show that there is wide variation in how people feel about their financial well-being. The report provides insight into which subgroups are faring relatively well and which ones are facing greater financial challenges, and identifies opportunities to improve the financial well-being of significant portions of the U.S. adult population through practice and research.
Why are lower-income parents less likely to open an RESP account? The roles of literacy, education and wealth
Parents can save for their children's postsecondary education by opening and contributing to a Registered Education Savings Plan (RESP) account, which provides tax and other financial incentives designed to encourage participation (particularly among lower-income families). While the share of parents opening RESP accounts has increased steadily over time, as of 2016, participation rates remained more than twice as high among parents in the top income quartile (top 25%) compared with those in the bottom quartile. This study provides insight into the factors behind the gap in (RESP) participation between higher and lower-income families.
Income Volatility: Why it Destabilizes Working Families and How Philanthropy Can Make a Difference
As the work environment has evolved and jobs look more different, it is important to understand the impact of these changes on income—predictability, variability, and frequency—and how this affects the opportunity for mobility. Because of the complexity of income volatility, there is a unique role for philanthropy. This brief helps grantmakers understand the enormous challenges income volatility presents in America and provides an array of strategies for philanthropy to leverage both investments and leadership to empower families to protect themselves from volatility’s worst effects.
Financial Health Index: 2019 Findings and 3-Year Trends Report
This report explores consumer financial health, wellness/ stress and resilience for Canadians across a range of financial health indicators, demographics and all provinces excluding Quebec. This report provides topline results from the 2019 Financial Health Index study and three-year trends from 2017 to 2019.
2018 White Paper: Financial Wellbeing Remains Challenged in Canada
The study examines consumers’ financial knowledge and confidence levels; financial and money stressors, financial capability aspects and financial management behaviours and practices (across the financial services spectrum). The study also explores external or environmental factors such as income variability and the extent to which Canadians have access to and lever their social capital (i.e. their family and friends who can provide financial advice and/or support in times of hardship). The study also explores consumer financial product and service usage, debt management and debt stress, access to financial products, services, advice and tools, usage of more predatory financial services (e.g. payday lending) and perceived levels of support by consumers’ primary Financial Institution for their financial wellness. The study also provides benefits of improved support for financial providers improving the financial wellness of their customers – including from a banking share of wallet and brand perspective.
Urban Spotlight: Neighbourhood Financial Health Index findings for Canada’s cities
This report examines the financial health and vulnerability of households in Canada’s 35 largest cities, using a new composite index of household financial health at the neighbourhood level, the Neighbourhood Financial Health Index or NFHI. The NFHI is designed to shine a light on the dynamics underlying national trends, taking a closer look at what is happening at the provincial/territorial, community and neighbourhood levels. Update July 22, 2022: Please note that the Neighbourhood Financial Health Index is no longer available
Canadians and their money: Key findings from the 2019 Canadian Financial Capability Survey
This report provides results from the 2019 Canadian Financial Capability Survey (CFCS). It offers a first look at what Canadians are doing to take charge of their finances by budgeting, planning and saving for the future, and paying down debt. While the findings show that many Canadians are acting to improve their financial literacy and financial well-being, there are also emerging signs of financial stress for some Canadians. For example, about one third of Canadians feel they have too much debt, and a growing number are having trouble making bill, rent/mortgage and other payments on time. Over the past 5 years, about 4 in 10 Canadians found ways to increase their financial knowledge, skills and confidence. They used a wide range of methods, such as reading books or other printed material on financial issues, using online resources, and pursuing financial education through work, school or community programs. Findings from the survey support evidence that financial literacy, resources and tools are helping Canadians manage their money. For example, those who have a budget have greater financial well-being based on a number of indicators, such as managing cashflow, making bill payments and paying down debt. Further, those with a
financial plan to save are more likely to feel better prepared and more confident about their retirement.
Trading Equity for Liquidity: Bank Data on the Relationship Between Liquidity and Mortgage Default
For many, homeownership is a vital part of the American dream. Buying a home represents one of the largest lifetime expenditures for most homeowners, and the mortgage has generally become the financing instrument of choice. For many families, their mortgage will be their greatest debt and their mortgage payment will be their largest recurring monthly expense. In this report, we present a combination of new analysis and previous findings from the JPMorgan Chase Institute body of housing finance research to answer important questions about the role of liquidity, equity, income levels, and payment burden as determinants of mortgage default. Our analysis suggests that liquidity may have been a more important predictor of mortgage default than equity, income level, or payment burden.
Debt and assets among senior Canadian families
Using data from the Survey of Financial Security (SFS), this article looks at changes in debt, assets and net worth among senior Canadian families over the period from 1999 to 2016. It also examines changes in the debt-to income ratio and the debt to-asset ratio of senior families with debt. This study finds that the proportion of senior families with debt increased from 27% to 42% between 1999 and 2016.
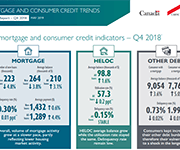
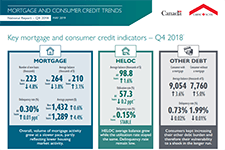
Mortgage and Consumer Credit Trends Report
The Canada Mortgage and Housing Corporation (CMHC) publishes a quarterly report on Canadian trends relating to mortgage debt and consumer borrowing. Find out the level of Canadian household indebtedness, and emerging trends in outstanding debt balances in different urban areas and by age group.
Economic Well-being Across Generations of Young Canadians: Are Millenials Better or Worse Off?
This article in the Economic Insights series from Statistics Canada examines the economic well-being of millennials by comparing their household balance sheets to those of previous generations of young Canadians. Measured at the same point in their life course, millennials were relatively better off than young Gen-Xers in terms of net worth, but also had higher debt levels. Higher values for principal residences and mortgage debt mainly explain these patterns. Financial outcomes varied considerably among millennial households. Home ownership, living in Toronto or Vancouver, and having a higher education were three factors associated with higher net worth.
Financial Expectations and Household Debt
This Economic Insights article quantifies the degree to which families who expect their financial situation to get better in the next two years have, all else equal, more debt than comparable families. The study shows that even after a large set of socioeconomic characteristics is controlled for, families who expect their financial situation to improve in the near future have significantly more debt and generally higher debt-to-income ratios than other families.
Debt and assets among senior Canadian families, 1999 to 2016
These results are from the new study "Debt and assets among senior Canadian families." released in April 2018. The study examines changes in debt, assets and net worth among Canadian families whose major income earner was 65 years of age or older. In recent years, household debt has increased. The level of debt and value of assets are especially important for the financial security of seniors. Because income typically declines during the retirement years, seniors often need accumulated assets to finance their consumption, especially if they do not benefit from a private pension plan. Debt can also be particularly problematic for seniors as repayment can be more difficult on a reduced income.
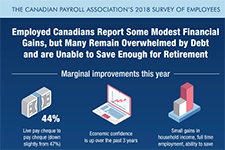
Infographic: Canadian Payroll Association’s 2018 Survey of Employees
This infographic shows results from the 2018 Survey of Employees conducted by the Canadian Payroll Association. It shows some marginal improvements but also some concerns. 44% of Canadians are living paycheque to paycheque, 40% feel overwhelmed by debt, and 72% have saved only one quarter or less of what they feel they'll need to retire. View full suite of news release and infographics from this survey, by province.
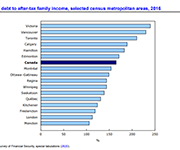
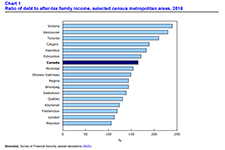
Indebtedness and Wealth Among Canadian Households
Understanding the health of the balance sheets of Canadian households is a complex issue that continues to generate considerable discussion. A new Statistics Canada study contributes to these discussions by highlighting the extent to which national measures of indebtedness and wealth mask significant variation across the country. The study is largely based on results from the 2016 Survey of Financial Security (SFS), which allow for a detailed profile by census metropolitan area (CMA) and by income groups.
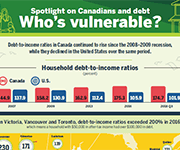
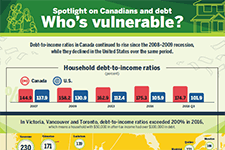
Spotlight on Canadians and Debt: Who’s Vulnerable
Debt-to-income ratios in Canada have continue to rise since the 2008-2009 recession, especially in urban centres where housing prices have increased over the last few years. This infographic from Statistics Canada shows where debt-to-income ratios are highest across Canada.
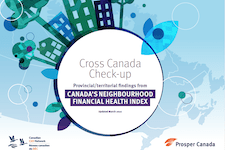
Cross Canada Check-up: Provincial/territorial findings from Canada’s Neighbourhood Financial Health Index
Canada ranks consistently as one of the best places to live in the world and one of the wealthiest. When it comes to looking at the financial health of Canadian households, however, we are often forced to rely on incomplete measures, like income alone, or aggregate national statistics that tell us little about the distribution of financial health and vulnerability in our neighbourhoods, communities or provinces/territories. The purpose of this report is to examine the financial heath and vulnerability of Canadian households in different provinces and territories using a new composite index of household financial health, the Neighbourhood Financial Health Index or NFHI. The NFHI has been designed to shine a light on the dynamics underlying these national trends, taking a closer look at what is happening at the provincial/territorial, community and neighbourhood levels. Update July 22, 2022: Please note that the Neighbourhood Financial Health Index is no longer available
Do we have the data we need to tackle household financial instability?
In this presentation Catherine Van Rompaey of Statistics Canada examines the data we have available to measure financial instability in Canada - household debt, savings, and credit. This presentation was given at the Prosper Canada Policy Research Symposium on March 9, 2018. Read the slide deck that accompanies this presentation. Pour lire les diapositives de la présentation, cliquez ici. View the full video playlist of all presentations from this symposium.
Canada’s household balance sheets
In this video presentation Andrew Heisz from Statistics Canada explains the changing household assets, debt, and income levels of Canadians of different age generations. This presentation was given at the Prosper Canada Policy Research Symposium on March 9, 2018. Read the slide deck that accompanies this presentation. View the full video playlist of all presentations from this symposium.


