Financial Health & Wealth
You worry about your family's physical, mental and spiritual health. You take care of yourself and make sure you and your family are healthy, safe and happy. Many people do not realize that you also need to be financially healthy. Financial wellness is understanding and managing your own money. Money is a big way that others control and influence our lives. Sometimes we need to depend on others to give us money and tell us what to do with money. Opening a bank account, understanding where your money is coming from, and saving money will help you to become financially independent and financially healthy. This report from The Native Women's Association of Canada covers the importance of financial health and has sections on financial information covering bank accounts, insurance, budgeting, saving, credit cards, car loans, income taxes and housing.
Making the most of your money
Managing money is challenging. In the current economic environment, it has become even more difficult. For people living on a low-income, managing the day-to-day expenses, let alone life changes or emergencies, can be overwhelming. Prosper Canada has created an online course that you can share or use with your clients to help them access tools and resources to support their daily money management. Making the most of your money is an easy-to-use, accessible, online course to help people living on a low income organize their finances and explore ways to increase the amount of money coming in and reduce what is going out. This interactive course has activities, videos, handouts and resources that are also downloadable.
Ottawa should soften bite of benefit clawbacks for low-income families
Canada’s tax system has a punitive impact on lower income families with children hoping to earn more money, according to a new report from the C.D. Howe Institute. In “Softening the Bite: The Impact of Benefit Clawbacks on Low-Income Families and How to Reduce It,” authors Alex Laurin and Nicholas Dahir reveal how benefit reductions serve as hidden tax rates and reduce the effective gain from working to generate additional income. Read full report here.
Income support, inflation, and homelessness
A good deal of attention has been paid to the question of what these high rates of inflation in housing and food costs mean for Canadians. Much of the concern has focused on the implications for middle-income Canadians hoping to purchase a home, while squeezing their household budgets. But what do these rates of inflation mean for Canadians with very low income? For them, high rates of inflation in the price of food and shelter mean more than having to delay thoughts of homeownership. For them, the threats are considerably more serious.
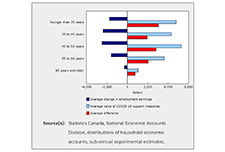
Household economic well-being during the COVID-19 pandemic, experimental estimates, fourth quarter 2020
A highlight of some of the findings reported in this briefing:
The effects of child tax benefits on the income of single mothers
The financial resources available to families with young children are an important factor affecting child development, and they can have long-term impacts on socioeconomic outcomes in adulthood. This article summarizes the findings of a new study using Statistic Canada’s data and analyzes the effects of expanding child tax benefits on after-tax income among single mothers, in the context of the 2015 reform to the Universal Child Care Benefit (UCCB) and the 2016 introduction of the Canada Child Benefit (CCB).
The relationship between COVID-19 pandemic and people in poverty: Exploring the impact scale and potential policy responses
This research project aims to identify the relationship between COVID-19 pandemic and poverty in Vancouver, by analyzing how the COVID-19 pandemic has pushed people into poverty and the impact of COVID-19 on people already living in poverty. Several examples of COVID-19 recovery policies and projects being implemented elsewhere that could support people experiencing poverty in Vancouver are also provided.
Longitudinal Immigration Database: Asylum claimant and immigrant economic region tables, 2018
Tables on the income and mobility of immigrants by economic region, and a table on asylum claimant economic outcomes, are now available. These tables use data from the Longitudinal Immigration Database.
Longitudinal Immigration Database: Immigrant children and census metropolitan area tables, 2018
The most recent 2018 data from the Longitudinal Immigration Database (IMDB) indicate that immigrant children make a significant contribution to Canadian society and the Canadian economy over time. Although immigrant children (32.2%) are more than twice as likely as non-immigrant children (15.4%) to live in low-income households, factors such as the opportunity to be educated in the Canadian system and an increased proficiency in the official languages help immigrant children attain wages in adulthood similar to those of their Canadian-born peers. This analysis connects the characteristics of immigrants who came to Canada as children with their adulthood socioeconomic outcomes in 2018, such as participation in postsecondary education and median wages. The IMDB provides a long-term perspective on immigrants and their socioeconomic outcomes in Canada, offering details on how immigration is shaping Canada's future. In addition, these data from 2018 contribute to baseline estimates in preparation for future research on the impact of the COVID-19 pandemic on immigrant children, including immigrant children admitted during the pandemic, their adjustment period and their long-term socioeconomic outcomes in adulthood.
Cross Canada Check-up (updated March 2021)
Canada ranks consistently as one of the best places to live in the world and one of the wealthiest. When it comes to looking at the financial health of Canadian households, however, we are often forced to rely on incomplete measures, like income alone, or aggregate national statistics that tell us little about the distribution of financial health and vulnerability in our neighbourhoods, communities or provinces/territories. The purpose of this report is to examine the financial heath and vulnerability of Canadian households in different provinces and territories using a new composite index of household financial health, the Neighbourhood Financial Health Index or NFHI.
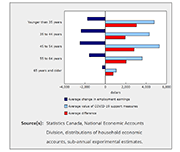
Household economic well-being during the COVID-19 pandemic, experimental estimates, first quarter to third quarter of 2020
Over the first three quarters of 2020, disposable income for the lowest-income households increased 36.8%, more than for any other households. At the same time, the youngest households recorded the largest gain in their net worth (+9.8%). These changes were driven by unprecedented increases in transfers to households, as the value of government COVID-19 support measures exceeded losses in wages and salaries and self-employment income. As the pandemic unfolded in Canada, households experienced extraordinary changes in their economic well-being. While quarterly releases of gross domestic product and the national balance sheet provide an aggregate view of these impacts, new experimental sub-annual distributions of household economic accounts (DHEA), released today, provide insight into how the pandemic and the associated government support measures have affected the economic well-being of different groups of households in Canada.
Low income measure (LIM) thresholds by income source and household size
Low income measure (LIM) thresholds by household size for market income, total income and after-tax income, in current and constant dollars, annual.
Trends in Intergenerational Income Mobility and Income Inequality in Canada
In this paper, administrative Canadian tax data are exploited to compute measures of intergenerational income mobility at the national, provincial and territorial levels. This work provides detailed descriptive evidence on trends in social mobility. Five cohorts of Canadians, born between 1963 and 1985, are observed as teens living with their parents and again as adults in their late 20s and early 30s.
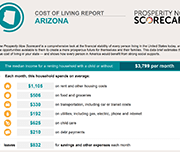
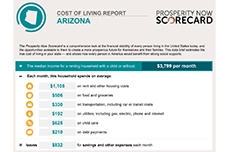
Prosperity Now Scorecard Cost-Of-Living Profiles by State
Prosperity Now has created state-level Cost-of-Living profiles as new features on their Scorecard website. The Prosperity Now Cost of Living profiles provide a comprehensive look at the financial stability of every person living in the United States. Each state profile can be downloaded and used to determine the true cost of living is in the state, based on median monthly income and discretionary spending left at the end of each month after expenses. These values determine what is left over for emergency expenses and long-term aspirational expenses. This video presents the cost of living in Georgia.
Income and mobility of immigrants, 2018
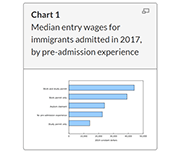
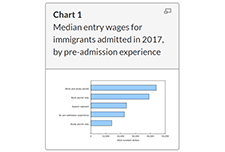
The COVID-19 pandemic has affected many aspects of Canadian immigration, including reduced permanent resident admissions and lower labour market outcomes. This article presents the latest economic and mobility outcomes of immigrants admitted to Canada using data from the 2019 Longitudinal Immigration Database, and provides baseline estimates prior to the pandemic for future analyses. In recent years, the profile of immigrants admitted to Canada has changed. The median entry wage for immigrants admitted to Canada in 2017 was the highest to date, reaching $30,100 in 2018. This value surpassed the previous high of $26,500 for 2017 outcomes of immigrants admitted in 2016. These new data also highlight a decreasing gap between the immigrant median entry wage and the Canadian median wage ($37,400). Factors such as pre-admission experience, knowledge of official languages, and category of admission, among other socioeconomic characteristics, could contribute to the rise in median entry wage compared with previous admission years.
Statistic Canada’s Longitudinal Immigration Database: Birth area and income table, 2018
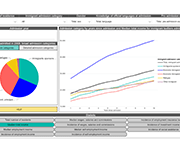
Statistics Canada's Longitudinal Immigration Database (IMDB) Interactive Application has been updated to include data on citizenship intake rates and income by birth area, sex, pre-admission experience and admission category. This table includes income measures up to 2018 for immigrants admitted to Canada since 2008.
Inter-generational comparisons of household economic well-being, 1999 to 2019
This study of data from the Distributions of Household Economic Accounts compares households' economic well-being from a macro-economic accounts perspective, as measured by net saving and net worth for each generation when the major income earner for a household in one generation reached the same point in the life cycle as the major income earner for a household in another generation. The study finds that while younger generations have higher disposable income and higher consumption expenditure than older generations when they reached the same age, their net saving is relatively similar. As well, younger generations' economic well-being may be more at risk due to the COVID-19 pandemic since they depend more on employment as a primary source of income, they have higher debt relative to income, and they have less equity in financial and real estate assets from which to draw upon when needed.
Achieving financial resilience in the face of financial setbacks
The Asset Funders Network (AFN) developed this primer to inform community-based strategies that can help economically-vulnerable families to better manage financial setbacks, shortfalls, and shocks. The goal of this brief is to provide a common understanding and language for funders and financial capability programs as part of a financial emergency toolkit.
Lifting the Weight: Consumer Debt Solutions Framework
Aspen Financial Security Program’s the Expanding Prosperity Impact Collaborative (EPIC) has identified seven specific consumer debt problems that result in decreased financial insecurity and well-being. Four of the identified problems are general to consumer debt: households’ lack of savings or financial cushion, restricted access to existing high-quality credit for specific groups of consumers, exposure to harmful loan terms and features, and detrimental delinquency, default, and collections practices. The other three problems relate to structural features of three specific types of debt: student loans, medical debt, and government fines and fees. This report presents a solutions framework to address all seven of these problems. The framework includes setting one or more tangible goals to achieve for each problem, and, for each goal, the solutions different sectors (financial services providers, governments, non-profits, employers, educational or medical institutions) can pursue.
Growing up in a lower-income family can have lasting effects
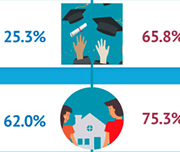
The infographic "Intergenerational income mobility: The lasting effects of growing up in a lower-income family" based on the article "Exploration of the role of education in intergenerational income mobility in Canada: Evidence from the Longitudinal and International Study of Adults," published in the Canadian Public Policy journal presents the effects of growing up in a lower-income family based on a longitudinal study of a cohort of Canadians born between 1963 and 1979.
Low Income Measure: Comparison of Two Data Sources, T1 Family File and 2016 Census of Population
This study looks at the differences in after-tax low income measure (LIM) statistics from two data sources which both use administrative tax data as their principal inputs: the 2016 Census of Population and the T1 Family file (T1FF). It presents a summary of the two data sources and compares after-tax LIM statistics by focussing on unit of analysis, LIM thresholds and the percentage of population below the LIM. The study also explores what factors users may want to consider when choosing one data source over the other.
Changes in the socioeconomic situation of Canada’s Black population
This study provides disaggregated statistics on the socioeconomic outcomes of the Black population by generation status (and immigrant status), sex and country of origin, and is intended to illustrate and contribute to the relevance of disaggregation in understanding these populations and the diversity of their situation. This study sheds light on some of the issues faced by the Black population and shows differences that exist compared with the rest of the working-age population, by sex, generation and place of origin, from 2001 to 2016.
Weathering Volatility 2.0: A Monthly Stress Test to Guide Savings
In this report, the JPMorgan Chase Institute uses administrative bank account data to measure income and spending volatility and the minimum levels of cash buffer families need to weather adverse income and spending shocks. Inconsistent or unpredictable swings in families’ income and expenses make it difficult to plan spending, pay down debt, or determine how much to save. Managing these swings, or volatility, is increasingly acknowledged as an important component of American families’ financial security. This report makes further progress toward understanding how volatility affects families and what levels of cash buffer they need to weather adverse income and spending shocks.
U.S. Financial Health Pulse: 2019 Trends Report
This report presents findings from the second annual U.S. Financial Health Pulse, which is designed to explore how the financial health of people in America is changing over time. The annual Pulse report scores survey respondents against eight indicators of financial health -- spending, bill payment, short-term and long-term savings, debt load, credit score, insurance coverage, and planning -- to assess whether they are “financially healthy,” “financially coping,” or “financially vulnerable”. The data in the Pulse report provide critical insights that go beyond aggregate economic indicators, such as employment and market performance, to provide a more accurate picture of the financial lives of people in the U.S.
Financial well-being in America
This report provides a view into the state of financial well-being in America. It presents results from the National Financial Well-Being Survey, conducted in late 2016. The findings include the distribution of financial well-being scores for the overall adult population and for selected subgroups, which show that there is wide variation in how people feel about their financial well-being. The report provides insight into which subgroups are faring relatively well and which ones are facing greater financial challenges, and identifies opportunities to improve the financial well-being of significant portions of the U.S. adult population through practice and research.
Prosperity Now Scorecard
The Prosperity Now Scorecard is a comprehensive resource featuring data on family financial health and policy recommendations to help put all U.S. households on a path to prosperity. The Scorecard equips advocates, policymakers and practitioners with national, state, and local data to jump-start a conversation about solutions and policies that put households on stronger financial footing across five issue areas: Financial Assets & Income, Businesses & Jobs, Homeownership & Housing, Health Care and Education.
Why are lower-income parents less likely to open an RESP account? The roles of literacy, education and wealth
Parents can save for their children's postsecondary education by opening and contributing to a Registered Education Savings Plan (RESP) account, which provides tax and other financial incentives designed to encourage participation (particularly among lower-income families). While the share of parents opening RESP accounts has increased steadily over time, as of 2016, participation rates remained more than twice as high among parents in the top income quartile (top 25%) compared with those in the bottom quartile. This study provides insight into the factors behind the gap in (RESP) participation between higher and lower-income families.
Income Volatility: Why it Destabilizes Working Families and How Philanthropy Can Make a Difference
As the work environment has evolved and jobs look more different, it is important to understand the impact of these changes on income—predictability, variability, and frequency—and how this affects the opportunity for mobility. Because of the complexity of income volatility, there is a unique role for philanthropy. This brief helps grantmakers understand the enormous challenges income volatility presents in America and provides an array of strategies for philanthropy to leverage both investments and leadership to empower families to protect themselves from volatility’s worst effects.
Inequality in the feasibility of working from home during and after COVID-19
The economic lockdown to stop the spread of COVID-19 has led to steep declines in employment and hours worked for many Canadians. For workers in essential services, in jobs that can be done with proper physical distancing measures or in jobs that can be done from home, the likelihood of experiencing a work interruption during the pandemic is lower than for other workers. To shed light on these issues, this article assesses how the feasibility of working from home varies across Canadian families. It also considers the implications of these differences for family earnings inequality.
Canadian Income Survey, 2018
This report from Statistics Canada shares data on median after-tax income and overall poverty rate decline based on 2018 data.
Comparison of Provincial and Territorial Child Benefits and Recommendations for British Columbia
First Call BC Child and Youth Advocacy Coalition has been tracking child and family poverty rates in BC for more than two decades. Every November, with the support of the Social Planning and Research Council of BC (SPARC BC), a report card is released with the latest statistics on child and family poverty in BC and recommendations for policy changes that would reduce these poverty levels. This report presents data from the latest report card released by First Call on a cross-Canada comparison of child benefits.
Working Without a Net: Rethinking Canada’s social policy in the new age of work
This report explores the implications of new technologies on Canada’s economy and labour market and the adequacy of current social programs and policies supporting workers.
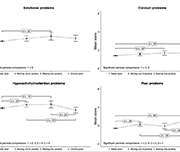
Economic volatility in childhood and subsequent adolescent mental health problems: a longitudinal population based study of adolescents
This research paper investigates the association between the patterns of duration, timing and sequencing of exposure to low family income during childhood, and symptoms of mental health problems in adolescence.
Defining Disposable income in the Market Basket Measure
This paper discusses the concept of disposable income used in the MBM. Disposable income is a measure of the means available to a Canadian family to meet its basic needs and achieve a modest standard of living. The disposable income of families surveyed in the Canadian Income Survey (CIS) is compared to the cost of the MBM basket for the size of the family and the region, and families with disposable incomes below that cost are deemed to be living in poverty.
Financial Health Index: 2019 Findings and 3-Year Trends Report
This report explores consumer financial health, wellness/ stress and resilience for Canadians across a range of financial health indicators, demographics and all provinces excluding Quebec. This report provides topline results from the 2019 Financial Health Index study and three-year trends from 2017 to 2019.
2018 White Paper: Financial Wellbeing Remains Challenged in Canada
The study examines consumers’ financial knowledge and confidence levels; financial and money stressors, financial capability aspects and financial management behaviours and practices (across the financial services spectrum). The study also explores external or environmental factors such as income variability and the extent to which Canadians have access to and lever their social capital (i.e. their family and friends who can provide financial advice and/or support in times of hardship). The study also explores consumer financial product and service usage, debt management and debt stress, access to financial products, services, advice and tools, usage of more predatory financial services (e.g. payday lending) and perceived levels of support by consumers’ primary Financial Institution for their financial wellness. The study also provides benefits of improved support for financial providers improving the financial wellness of their customers – including from a banking share of wallet and brand perspective.
The Dynamics of Disability: Progressive, Recurrent or Fluctuating Limitations
Different from common perception, many disabilities do not follow a stable pattern. Persons with disabilities may experience periods of good health in between periods of their limitations and/or experience changes in the severity of their limitations over time. These types of disabilities may be characterized as dynamic because the very nature of the disability is one of change with different possible trajectories over time. As a consequence, the collective experiences of those with disability dynamics are likely to be different than those with so-called “continuous” disabilities. In this paper, four groups of persons with different disability dynamics (or lack of dynamics) are profiled based on data from the 2017 Canadian Survey on Disability. Each group has their own unique demographic, employment, and workplace accommodation profile based on the length of time between periods of their limitations, as well as changes in their limitations over time.
Results from the 2016 Census: Examining the effect of public pension benefits on the low income of senior immigrants
This is a study released by Insights on Canadian Society based on 2016 Census data. Census information on immigration and income is used to better understand the factors associated with low income among senior immigrants. This study examines the factors associated with the low-income rate of senior immigrants, with a focus on access to Old Age Security (OAS) and Guaranteed Income Supplement (GIS) benefits.
Canada’s Colour Coded Income Inequality
Canada’s population is increasingly racialized. The 2016 census counted 7.7 million racialized individuals in Canada. That number represented 22% of the population, up sharply from 16% just a decade earlier. Unfortunately, the rapid growth in the racialized population is not being matched by a corresponding increase in economic equality. This paper uses 2016 census data to paint a portrait of income inequality between racialized and non-racialized Canadians. It also looks at the labour market discrimination faced by racialized workers in 2006 and 2016. These data provide a glimpse of the likely differences in wealth between racialized and non-racialized Canadians. This paper also explores the relationship between race, immigration and employment incomes. Taken together, the data point to an unequivocal pattern of racialized economic inequality in Canada. In the absence of bold policies to combat racism, this economic inequality shows no signs of disappearing.
Budget Planner
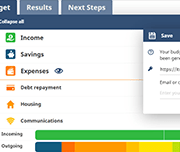
The Financial Consumer Agency of Canada (FCAC)'s online tool helps you create a customized budget.
Welfare in Canada, 2018
These reports look at the total incomes available to those relying on social assistance (often called “welfare”), taking into account tax credits and other benefits along with social assistance itself. The reports look at four different household types for each province and territory. Established by the Caledon Institute of Social Policy, Welfare in Canada is a continuation of the Welfare Incomes series originally published by the National Council of Welfare, based on the same approach.
Urban Spotlight: Neighbourhood Financial Health Index findings for Canada’s cities
This report examines the financial health and vulnerability of households in Canada’s 35 largest cities, using a new composite index of household financial health at the neighbourhood level, the Neighbourhood Financial Health Index or NFHI. The NFHI is designed to shine a light on the dynamics underlying national trends, taking a closer look at what is happening at the provincial/territorial, community and neighbourhood levels. Update July 22, 2022: Please note that the Neighbourhood Financial Health Index is no longer available
Trends in the Citizenship Rate Among New Immigrants to Canada
This Economic Insights article examines trends in the citizenship rate (the percent of immigrants who become Canadian citizens) among recent immigrants who arrived in Canada five to nine years before a given census. The citizenship rate among recent immigrants aged 18 and over peaked in 1996 and declined continuously to 2016. Most of this decline occurred after 2006. The citizenship rate declined most among immigrants with low family income, poor official language skills, and lower levels of education. There was also significant variation in the decline among immigrants from different source regions, with the decline largest among Chinese immigrants.
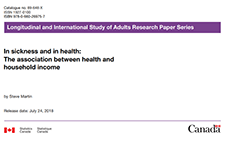
In sickness and in health: The association between health and household income
This study uses data from the Longitudinal and International Study of Adults (LISA) to analyze the association between health and household income. Using data on both self-reported general health and self-report mental health, as well as self-reported labour-market outcomes and linked tax records, the association between spouse-pair labour-market income and health is further decomposed into an employment effect reflecting the association between health and the probability of employment, an hours worked effect reflecting the association between health and the number of hours worked, and a wage effect reflecting
the association between health and hourly wages.
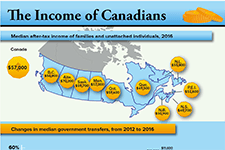
The income of Canadians
This infographic from Statistics Canada shows the median after-tax income of households, by province, as of 2016. It also shows changes in median government transfers, and number of people living on low incomes according to the after-tax low income measure.
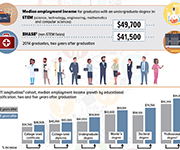
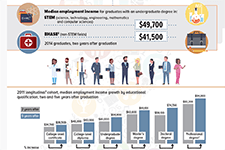
Infographic: Labour market outcomes for college and university graduates, 2010 to 2014
This infographic from Statistics Canada shows the labour market outcomes for college and university graduates between 2010 and 2014. It shows the median employment income achieved by graduates of different education levels, 2 years and 5 years post-graduation. Overall, it shows that people with higher levels of post-secondary education report higher employment income post-graduation.
Economic Well-being Across Generations of Young Canadians: Are Millenials Better or Worse Off?
This article in the Economic Insights series from Statistics Canada examines the economic well-being of millennials by comparing their household balance sheets to those of previous generations of young Canadians. Measured at the same point in their life course, millennials were relatively better off than young Gen-Xers in terms of net worth, but also had higher debt levels. Higher values for principal residences and mortgage debt mainly explain these patterns. Financial outcomes varied considerably among millennial households. Home ownership, living in Toronto or Vancouver, and having a higher education were three factors associated with higher net worth.
The Economic Well-Being of Women in Canada
Economic well-being has both a present component and a future component. In the present, economic well-being is characterized by the ability of individuals and small groups, such as families or households, to consistently meet their basic needs, including food, clothing, housing, utilities, health care, transportation, education, and paid taxes. It is also characterized by the ability to make economic choices and feel a sense of security, satisfaction, and personal fulfillment with respect to finances and employment pursuits. Using Statistics Canada data from a variety of sources, including the Survey of Labour and Income Dynamics, the Canadian Income Survey, the Survey of Financial Security, and the 2016 Census of Population, this chapter of Women in Canada examines women’s economic well-being in comparison with men’s and, where relevant, explores how it has evolved over the past 40 years. In addition to gender, age and family type (i.e., couple families with or without children; lone mothers and fathers; and single women and men without children) are important determinants of economic well-being. Hence, many of the analyses distinguish between women and men in different age groups and/or types of families.
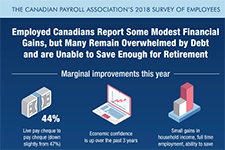
Infographic: Canadian Payroll Association’s 2018 Survey of Employees
This infographic shows results from the 2018 Survey of Employees conducted by the Canadian Payroll Association. It shows some marginal improvements but also some concerns. 44% of Canadians are living paycheque to paycheque, 40% feel overwhelmed by debt, and 72% have saved only one quarter or less of what they feel they'll need to retire. View full suite of news release and infographics from this survey, by province.
NPW 2018 Employee Research Survey
Working Canadians seem to be making some minor progress towards improving their financial health. But, while 66% report being in a better financial position than a year ago, their debt levels remain high, they chronically undersave for retirement, and put themselves at severe risk in the event of economic changes. According to the Canadian Payroll Association’s tenth annual survey, 44% of working Canadians report it would be difficult to meet their financial obligations if their pay cheque was delayed by even a single week (down from the three-year average of 48%). View full suite of news release and infographics from this survey, by province.
Pervasive and Profound: The Impact of Income Volatility on Canadians
In this video presentation Derek Burleton of TD Economics shares findings from the report 'Pervasive and Profound,' which examines income volatility trends in Canada. The survey found that nearly 40% of Canadians experience moderate to high income volatility. This presentation was given at the Prosper Canada Policy Research Symposium on March 9, 2018. Read the slide deck that accompanies this presentation. View the full video playlist of all presentations from this symposium.
The Perils of Living Paycheque to Paycheque
This report, 'The Perils of Living Paycheque to Paycheque: The relationship between income volatility and financial insecurity', examines the relationship between income instability and broader measures of financial well-being. This study makes use of a unique dataset that collected self-reported month-to-month volatility in household income, measures of capability, financial knowledge and psychological variables. One in three adult Canadians reported at least some volatility in their monthly incomes, with six per cent reporting that the source and amount were both uncertain. Income volatility is present across a wide swath of the survey respondents, regardless of gender, family status, region of the country, education level and even income sources. Income volatility is correlated with lower financial knowledge, lower financial capability, and stronger beliefs that financial outcomes are up to fate and outside of personal control.
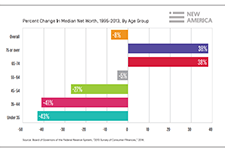
A Life-Cycle and Generational Perspective on the Wealth and Income of Millenials
Young adulthood is the life stage when the greatest increases in income and wealth typically occur, yet entering into this period during the Great Recession has put Millennials on a different trajectory. As a result, this generation will need to make very large gains in the years ahead to compensate for these shortfalls. Understanding the dynamics of how the recession has impaired the financial outlook of Millennials, such as identifying how far behind they are compared to previous
generations of young adults, the impact of the recession on their current wealth holdings and earning potential, and the pace at which they’re recovering, is essential to developing appropriate policy interventions that can put them back on track.
Cross Canada Check-up: Provincial/territorial findings from Canada’s Neighbourhood Financial Health Index
Canada ranks consistently as one of the best places to live in the world and one of the wealthiest. When it comes to looking at the financial health of Canadian households, however, we are often forced to rely on incomplete measures, like income alone, or aggregate national statistics that tell us little about the distribution of financial health and vulnerability in our neighbourhoods, communities or provinces/territories. The purpose of this report is to examine the financial heath and vulnerability of Canadian households in different provinces and territories using a new composite index of household financial health, the Neighbourhood Financial Health Index or NFHI. The NFHI has been designed to shine a light on the dynamics underlying these national trends, taking a closer look at what is happening at the provincial/territorial, community and neighbourhood levels. Update July 22, 2022: Please note that the Neighbourhood Financial Health Index is no longer available
Who pays? A Distributional Analysis of the Tax Systems in all 50 States
Who Pays: A Distributional Analysis of the Tax Systems in All Fifty States (the sixth edition of the report) is the only distributional analysis of tax systems in all 50 states and the District of Columbia. This comprehensive report assesses tax fairness by measuring effective state and local tax rates paid by all income groups. No two state tax systems are the same; this report provides detailed analyses of the features of every state tax code. It includes state-by-state profiles that provide baseline data to help lawmakers and the public understand how current tax policies affect taxpayers at all income levels.
Up Close and Personal: Findings from the U.S. Financial Diaries
In this video presentation Rob Levy from the Center for Financial Services Innovation (CFSI) shares some of the findings from the U.S. Financial Diaries project. He explains how the households in the study experience multiple "spikes" and "dips" in income and spending over the course of a single year. This presentation was given at the Prosper Canada Policy Research Symposium on March 9, 2018. Read the slide deck that accompanies this presentation. Pour lire les diapositives de la présentation, cliquez ici. View the full video playlist of all presentations from this symposium.
Income volatility: What banking data can tell us, if we ask
In this video presentation Fiona Greig from the JP Morgan Chase Institute explains what banking data can tell us about income volatility in the United States. This presentation was given at the Prosper Canada Policy Research Symposium on March 9, 2018. Read the slide deck that accompanies this presentation. Pour lire les diapositives de la présentation, cliquez ici. View the full video playlist of all presentations from this symposium.
Financial well-being in America
There is wide variation in how people in the U.S. feel about their financial well-being. This report presents findings from a survey by the Consumer Financial Protection Bureau (CFPB) on the distribution of financial well-being scores for the U.S. adult population overall and for selected subgroups defined by these additional measures. These descriptive findings provide insight into which subgroups are faring relatively well and which ones are facing greater financial challenges.

