Additional Information
Please fill-in the following information before you start your courses:
First Name: Last Name: Organization/Agency your work for: (Please put N/A if you are not working for anyone) City and province: Which of the following financial empowerment services does your organization provide? (Check any that apply): Please specify: Save
Show inline popup
Prosper Canada Learning HubBrowse
Asset building and saving
Best practices
Collective impact
Consumer protection
Credit & Debt
Curriculum & Training
Financial behaviour/decisions
Financial coaching & counselling
Financial inclusion
Financial literacy
Financial well-being
Health
Housing and homelessness
Lived experience
Poverty issues
Racial equity
Research and evaluation
Service system integration
Tax filing and benefits
  • Prosper Canada
  • Organization Directory
  • Toolkit
  • Topics
  • Woo Store
  • FAQ
  • Log In
  • Menu Menu
  • 0Shopping Cart
  • Home
  • Resources
    • ToolkitsHelpful handouts, templates and guides
    • Discover LibraryUse robust search tools to pinpoint resources, research, case studies, and more
    • RDSP CalculatorDemonstrate the power of an RDSP
    • Bridge to BenefitsLearn how to best support your clients in accessing benefits
    • Benefits WayfinderInvestigate what benefits your client may be eligible for
  • Training & Courses
    • Online coursesTrain new staff or refresh fundamentals
    • WorkshopsAttend an interactive workshop on benefits
    • ConferencesNetwork with peers and stay up to date or watch a previously recorded conference
  • Webinars
  • Tools for Clients
    • Benefits WayfinderInvestigate what benefits your client may be eligible for
    • TroveA hub for clients to to empower themselves
    • Making the Most of Your MoneyCourse to help clients learn about managing money
    • My Money in CanadaBeginner’s course to help clients learn about Canada’s financial system
    • RDSP CalculatorDemonstrate the power of an RDSP
    • ToolkitsClients may also find some toolkits helpful with guides and templates on managing finances
  • Events
  • Directory
  • Store

Employed persons with disabilities or long-term conditions- infographic

https://learninghub.prospercanada.org/wp-content/uploads/2025/02/infographic-disabilities.png 152 225 Shermeen Beg https://learninghub.prospercanada.org/wp-content/uploads/2018/01/Prosper_Canada_Hub_weblogo.png Shermeen Beg2025-02-27 13:46:502025-02-27 13:46:52Employed persons with disabilities or long-term conditions- infographic

Health indicators for First Nations adults living off reserve, Métis and Inuit adults, 2015 to 2022

https://learninghub.prospercanada.org/wp-content/uploads/2022/02/statscan.png 152 225 Shermeen Beg https://learninghub.prospercanada.org/wp-content/uploads/2018/01/Prosper_Canada_Hub_weblogo.png Shermeen Beg2025-02-27 13:30:132025-02-27 13:30:14Health indicators for First Nations adults living off reserve, Métis and Inuit adults, 2015 to 2022

Quality of life indicators from the Canadian Social Survey, fourth quarter 2024

https://learninghub.prospercanada.org/wp-content/uploads/2022/02/statscan.png 152 225 Shermeen Beg https://learninghub.prospercanada.org/wp-content/uploads/2018/01/Prosper_Canada_Hub_weblogo.png Shermeen Beg2025-02-27 13:26:552025-02-27 13:26:56Quality of life indicators from the Canadian Social Survey, fourth quarter 2024

A look at income sources of racialized individuals 65 years and over in Canada, 2020

https://learninghub.prospercanada.org/wp-content/uploads/2025/02/income-sources.png 152 225 Shermeen Beg https://learninghub.prospercanada.org/wp-content/uploads/2018/01/Prosper_Canada_Hub_weblogo.png Shermeen Beg2025-02-07 11:35:242025-02-07 11:35:26A look at income sources of racialized individuals 65 years and over in Canada, 2020

Impacts of rising prices on the well-being of Indigenous people, 2024

https://learninghub.prospercanada.org/wp-content/uploads/2022/02/statscan.png 152 225 Shermeen Beg https://learninghub.prospercanada.org/wp-content/uploads/2018/01/Prosper_Canada_Hub_weblogo.png Shermeen Beg2025-02-07 09:16:162025-02-07 09:16:17Impacts of rising prices on the well-being of Indigenous people, 2024

Trends and patterns in Canadians’ use of digital banking and technologies

https://learninghub.prospercanada.org/wp-content/uploads/2024/09/trends-and-patterns.png 154 225 Shermeen Beg https://learninghub.prospercanada.org/wp-content/uploads/2018/01/Prosper_Canada_Hub_weblogo.png Shermeen Beg2024-09-05 10:25:362024-09-05 10:25:37Trends and patterns in Canadians’ use of digital banking and technologies

Trends in online banking and shopping

https://learninghub.prospercanada.org/wp-content/uploads/2022/02/statscan.png 152 225 Shermeen Beg https://learninghub.prospercanada.org/wp-content/uploads/2018/01/Prosper_Canada_Hub_weblogo.png Shermeen Beg2024-05-03 10:20:262024-05-03 10:20:27Trends in online banking and shopping

Intergenerational housing outcomes in Canada

https://learninghub.prospercanada.org/wp-content/uploads/2022/02/statscan.png 152 225 Shermeen Beg https://learninghub.prospercanada.org/wp-content/uploads/2018/01/Prosper_Canada_Hub_weblogo.png Shermeen Beg2024-05-03 09:58:252024-05-03 09:58:26Intergenerational housing outcomes in Canada

Indigenous peoples economic account, 2012 to 2021

https://learninghub.prospercanada.org/wp-content/uploads/2019/09/government-of-canada.png 154 225 Shermeen Beg https://learninghub.prospercanada.org/wp-content/uploads/2018/01/Prosper_Canada_Hub_weblogo.png Shermeen Beg2024-04-10 11:47:232024-04-10 11:47:24Indigenous peoples economic account, 2012 to 2021

Trends in online banking and shopping

https://learninghub.prospercanada.org/wp-content/uploads/2022/02/statscan.png 152 225 Shermeen Beg https://learninghub.prospercanada.org/wp-content/uploads/2018/01/Prosper_Canada_Hub_weblogo.png Shermeen Beg2024-03-21 08:57:372024-03-21 08:57:38Trends in online banking and shopping

Status First Nations People in Canada: A snapshot from the 2021 census

https://learninghub.prospercanada.org/wp-content/uploads/2023/10/FN-2021-census.png 152 225 Shermeen Beg https://learninghub.prospercanada.org/wp-content/uploads/2018/01/Prosper_Canada_Hub_weblogo.png Shermeen Beg2023-10-30 10:16:582023-10-30 10:16:59Status First Nations People in Canada: A snapshot from the 2021 census

Poverty persists among some racialized Canadians from the first generation to the third generation or more

https://learninghub.prospercanada.org/wp-content/uploads/2022/02/statscan.png 152 225 Shermeen Beg https://learninghub.prospercanada.org/wp-content/uploads/2018/01/Prosper_Canada_Hub_weblogo.png Shermeen Beg2023-08-25 13:14:592023-08-25 13:15:00Poverty persists among some racialized Canadians from the first generation to the third generation or more

Highlights from a new study on the lifetime earnings growth of individuals with childhood-onset disabilities

https://learninghub.prospercanada.org/wp-content/uploads/2022/02/statscan.png 152 225 Shermeen Beg https://learninghub.prospercanada.org/wp-content/uploads/2018/01/Prosper_Canada_Hub_weblogo.png Shermeen Beg2023-08-11 09:37:412023-08-11 09:37:42Highlights from a new study on the lifetime earnings growth of individuals with childhood-onset disabilities

Market basket measure research paper: Child care expenses

https://learninghub.prospercanada.org/wp-content/uploads/2022/02/statscan.png 152 225 Shermeen Beg https://learninghub.prospercanada.org/wp-content/uploads/2018/01/Prosper_Canada_Hub_weblogo.png Shermeen Beg2023-08-11 09:32:332023-08-11 09:32:35Market basket measure research paper: Child care expenses

By the numbers: Black History month 2023


https://learninghub.prospercanada.org/wp-content/uploads/2023/07/black-history-month-2023.png 152 225 Shermeen Beg https://learninghub.prospercanada.org/wp-content/uploads/2018/01/Prosper_Canada_Hub_weblogo.png Shermeen Beg2023-07-26 15:17:482023-07-26 15:17:48By the numbers: Black History month 2023

Distributions of household economic accounts for income, consumption, saving and wealth of Canadian households, first quarter 2023


https://learninghub.prospercanada.org/wp-content/uploads/2022/02/statscan.png 152 225 Shermeen Beg https://learninghub.prospercanada.org/wp-content/uploads/2018/01/Prosper_Canada_Hub_weblogo.png Shermeen Beg2023-07-12 13:30:012023-07-12 13:30:01Distributions of household economic accounts for income, consumption, saving and wealth of Canadian households, first quarter 2023

What is the pay gap between persons with and without disabilities?


https://learninghub.prospercanada.org/wp-content/uploads/2022/02/statscan.png 152 225 Shermeen Beg https://learninghub.prospercanada.org/wp-content/uploads/2018/01/Prosper_Canada_Hub_weblogo.png Shermeen Beg2023-07-12 13:16:012023-07-12 13:51:09What is the pay gap between persons with and without disabilities?

More Canadians are finding it difficult to meet food, shelter and other necessary expenses

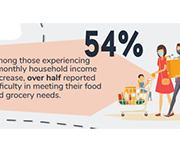
In 2022, the Consumer Price Index rose 6.8%, the highest increase since 1982 (+10.9%). Prices for day-to-day goods and services such as transportation (+10.6%), food (+8.9%) and shelter (+6.9%) rose the most.

Canadians felt the impact of rising prices. Data from the Canadian Social Survey (CSS) show that the share of persons aged 15 and older living in a household experiencing difficulty meeting its necessary expenses trended upward from just under one-fifth (19%) in the summer of 2021 to just under one-quarter (24%) in the summer of 2022. By the end of 2022, more than one-third (35%) of the population lived in such a household.


https://learninghub.prospercanada.org/wp-content/uploads/2022/02/statscan.png 152 225 Shermeen Beg https://learninghub.prospercanada.org/wp-content/uploads/2018/01/Prosper_Canada_Hub_weblogo.png Shermeen Beg2023-03-16 14:51:512023-03-16 15:30:32More Canadians are finding it difficult to meet food, shelter and other necessary expenses

Income in retirement: Expectations versus reality

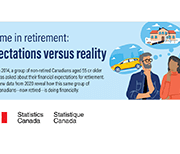
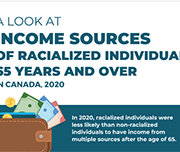
In 2014, a group of non-retired Canadians aged 55 or older was asked about their financial expectations for retirement. New data from 2020 reveal how this same group of Canadians - now retired- is doing financially. 


https://learninghub.prospercanada.org/wp-content/uploads/2023/02/retirement.png 154 225 Shermeen Beg https://learninghub.prospercanada.org/wp-content/uploads/2018/01/Prosper_Canada_Hub_weblogo.png Shermeen Beg2023-02-23 15:10:512023-02-23 15:10:51Income in retirement: Expectations versus reality

Consumer Price Index: Annual review, 2022

The Consumer Price Index (CPI) rose 6.8% on an annual average basis in 2022, following gains of 3.4% in 2021 and of 0.7% in 2020. The increase in 2022 was a 40-year high, the largest increase since 1982 (+10.9%). Excluding energy, the annual average CPI rose 5.7% in 2022 compared with 2.4% in 2021.

Price increases were broad-based in 2022, with prices up on an annual average basis in all eight major components. Canadians felt the impact of inflation, as prices for day-to-day basics such as transportation (+10.6%), food (+8.9%) and shelter (+6.9%) rose the most.

Both goods and services prices rose at a faster pace compared with a year earlier. Prices for goods were up 8.7% on an annual average basis in 2022, led by higher prices for non-durable goods such as food purchased from stores (+9.8%) and gasoline (+28.5%). Prices for services increased 5.0% in 2022, led by homeowners' replacement cost (+9.5%) and other owned accommodation expenses (+10.0%).

Year-over-year price growth accelerated each month in the first half of the year, reaching a high of 8.1% in June, and slowed in the second half of the year.


https://learninghub.prospercanada.org/wp-content/uploads/2022/02/statscan.png 152 225 Shermeen Beg https://learninghub.prospercanada.org/wp-content/uploads/2018/01/Prosper_Canada_Hub_weblogo.png Shermeen Beg2023-01-31 10:57:222023-01-31 10:57:22Consumer Price Index: Annual review, 2022

Housing conditions among racialized groups: A brief overview

In response to Canada's Anti-Racism Strategy, Statistics Canada's Centre for Gender, Diversity and Inclusion Statistics is releasing a second set of five data tables on social inclusion. Over 20 new indicators, for a total of over 120 indicators, can now be used to examine various socioeconomic facets of racialized Canadians. 


https://learninghub.prospercanada.org/wp-content/uploads/2022/02/statscan.png 152 225 Shermeen Beg https://learninghub.prospercanada.org/wp-content/uploads/2018/01/Prosper_Canada_Hub_weblogo.png Shermeen Beg2023-01-26 14:14:532023-01-26 14:14:53Housing conditions among racialized groups: A brief overview

Sustainable Development Goals: Goal 10, Reduced Inequalities

An infographic from Statistics Canada highlighting the advances made in reaching Goal 10, reducing inequalities, of the sustainable development goals. 


https://learninghub.prospercanada.org/wp-content/uploads/2022/12/SDG-10.png 154 225 Shermeen Beg https://learninghub.prospercanada.org/wp-content/uploads/2018/01/Prosper_Canada_Hub_weblogo.png Shermeen Beg2022-12-19 10:08:232022-12-19 10:08:23Sustainable Development Goals: Goal 10, Reduced Inequalities

By the numbers: Black History Month 2022


https://learninghub.prospercanada.org/wp-content/uploads/2022/08/Black-History-Month-2022.png 152 225 jdusomeprospercanada-org https://learninghub.prospercanada.org/wp-content/uploads/2018/01/Prosper_Canada_Hub_weblogo.png jdusomeprospercanada-org2022-08-09 11:24:172023-05-23 10:43:35By the numbers: Black History Month 2022

Survey on savings for persons with disabilities

Residents in Canada who have a severe and prolonged mental or physical disability are eligible for the Disability Tax Credit (DTC). This opens the door to other programs, one of which is the RDSP.

Less than one-third of eligible residents in Canada (up to age 59) have a Registered Disability Savings Plan (RDSP)—about 31.5% in 2020.

To understand why more eligible residents in Canada do not have an RDSP, Employment and Social Development Canada asked Statistics Canada to conduct the Survey on Savings for Persons with Disabilities. Its goal was to collect data from residents in Canada who were eligible for an RDSP but did not open one.

These respondents included both persons with disabilities and family members or others who care for persons with disabilities, since the holder of the plan may not be the same person as the beneficiary in all cases.

These data show that, in general, eligible residents in Canada lack information about the RDSP, with many not being aware it exists and a substantial portion reporting not having enough information or money to open one.


https://learninghub.prospercanada.org/wp-content/uploads/2022/02/statscan.png 152 225 Shermeen Beg https://learninghub.prospercanada.org/wp-content/uploads/2018/01/Prosper_Canada_Hub_weblogo.png Shermeen Beg2022-04-22 13:30:562022-04-22 13:30:56Survey on savings for persons with disabilities

Dimensions of poverty hub

Statistics Canada has created an "Opportunity for All"; a dashboard of 12 indicators to track progress on deep income poverty as well as the aspects of poverty other than income, including indicators of material deprivation, lack of opportunity and resilience.

These indicators are broadly grouped into three categories: dignity, opportunity and inclusion and resilience and security. 


https://learninghub.prospercanada.org/wp-content/uploads/2022/02/poverty-hub.png 152 225 Shermeen Beg https://learninghub.prospercanada.org/wp-content/uploads/2018/01/Prosper_Canada_Hub_weblogo.png Shermeen Beg2022-02-23 10:09:292022-02-23 10:09:29Dimensions of poverty hub

Asset resilience of Canadians, 2019

Canadians were more asset resilient just prior to the pandemic than they were at the turn of the millennium. That resilience continues to be tested as we enter the second year of the pandemic.

For the purposes of this article, a household is asset resilient when it has liquid assets that are at least equal to the after-tax, low-income measure (LIM-AT) for three months.

To be deemed asset resilient in 2019, a person living alone would require liquid assets of approximately $6,000. A household of four would require $12,000 or $3,000 per person to meet the minimum LIM-AT threshold for three months.

Recent Statistics Canada data have shown that savings rose sharply during the pandemic, despite the economic upheaval, and that those in the lower income quintiles have seen their income rise as a result of government support programs, such as the Canada Emergency Response Benefit (CERB).

Although the data in this release predate the pandemic, they provide an important benchmark to monitor the economic well-being of Canadian households during a time of unprecedented change.


https://learninghub.prospercanada.org/wp-content/uploads/2020/09/stats-can-logo.png 152 225 Carrie Wong https://learninghub.prospercanada.org/wp-content/uploads/2018/01/Prosper_Canada_Hub_weblogo.png Carrie Wong2021-08-23 11:50:132021-08-23 11:51:49Asset resilience of Canadians, 2019

A statistical portrait of Canada’s diverse LGBTQ2+ communities

Statistics Canada presents a demographic and social profile of Canada's diverse LGBTQ2+ communities based on published analyses. Much of the data in this release focus on LGB Canadians (lesbian, gay, bisexual), since Statistics Canada has been collecting detailed information on these communities since 2003.


https://learninghub.prospercanada.org/wp-content/uploads/2020/09/stats-can-logo.png 152 225 Carrie Wong https://learninghub.prospercanada.org/wp-content/uploads/2018/01/Prosper_Canada_Hub_weblogo.png Carrie Wong2021-08-23 11:42:222021-08-23 11:50:50A statistical portrait of Canada’s diverse LGBTQ2+ communities

Workers receiving payments from the Canada Emergency Response Benefit program in 2020

The Canada Emergency Response Benefit program (CERB) was introduced to provide financial support to employees and self-employed workers in Canada who were directly impacted by the COVID-19 pandemic. This article examines the proportion of 2019 workers who received CERB payments in 2020 by various characteristics. CERB take-up rates are presented by industry, earnings group in 2019, sex, age group and province, as well as for population groups designated as visible minorities, immigrants and Indigenous people. Some factors that help explain differences in take-up rates among these groups of workers are also examined.


https://learninghub.prospercanada.org/wp-content/uploads/2020/09/stats-can-logo.png 152 225 Carrie Wong https://learninghub.prospercanada.org/wp-content/uploads/2018/01/Prosper_Canada_Hub_weblogo.png Carrie Wong2021-07-07 09:56:312021-07-07 09:56:31Workers receiving payments from the Canada Emergency Response Benefit program in 2020

Household economic well-being during the COVID-19 pandemic, experimental estimates, fourth quarter 2020

A highlight of some of the findings reported in this briefing:

  • Disposable income declined for most households in the fourth quarter of 2020, with the largest losses for the lowest-income earners (-10.2%).
  • Compensation of employees—of which wages and salaries make up the largest share—was up in the fourth quarter.
  • The most pronounced wage losses were experienced by the lowest-income (-5.3%) and the youngest (-3.1%) households, as many people in these households work in industries or jobs hard hit by the pandemic.
  • There was a decline in COVID-19-specific support measures and a significant rise in EI benefits in the fourth quarter of 2020.
  • Overall consumption expenditure was down in 2020 compared with 2019.
  • Net saving for many households declined as their disposable income decreased and consumption edged up.
  • The debt-to-income ratio increased the most for households in the lowest income quintile.


https://learninghub.prospercanada.org/wp-content/uploads/2020/09/stats-can-logo.png 152 225 Carrie Wong https://learninghub.prospercanada.org/wp-content/uploads/2018/01/Prosper_Canada_Hub_weblogo.png Carrie Wong2021-07-07 09:04:092021-07-07 09:04:09Household economic well-being during the COVID-19 pandemic, experimental estimates, fourth quarter 2020

A labour market snapshot of South Asian, Chinese and Filipino Canadians during the pandemic

The COVID-19 pandemic has highlighted the varying labour market experiences and outcomes of diverse groups of Canadians.

To mark Asian Heritage Month, Statistics Canada is providing a profile of the employment characteristics of the three largest Asian populations in Canada: South Asian, Chinese and Filipino Canadians.

Results from the Labour Force Survey (LFS) show that South Asian men are much more likely to be employed than South Asian women, that Chinese Canadians have higher average hourly wages than other visible minority groups, and that Filipino women have among the highest employment rates of all groups, with many working on the front line in the health care sector during the pandemic.

Unless otherwise stated, all data in this article reflect the population aged 15 to 69 during the three months ending in April 2021, and are not seasonally adjusted.


https://learninghub.prospercanada.org/wp-content/uploads/2020/09/stats-can-logo.png 152 225 Carrie Wong https://learninghub.prospercanada.org/wp-content/uploads/2018/01/Prosper_Canada_Hub_weblogo.png Carrie Wong2021-05-25 16:44:232021-05-25 16:44:37A labour market snapshot of South Asian, Chinese and Filipino Canadians during the pandemic

Labour Force Survey, April 2021

April Labour Force Survey (LFS) data reflect labour market conditions during the week of April 11 to 17.


https://learninghub.prospercanada.org/wp-content/uploads/2020/09/stats-can-logo.png 152 225 Carrie Wong https://learninghub.prospercanada.org/wp-content/uploads/2018/01/Prosper_Canada_Hub_weblogo.png Carrie Wong2021-05-25 16:30:172021-05-25 16:30:17Labour Force Survey, April 2021

Non-Profit Organizations and Volunteering Satellite Account: Human Resources Module, 2010 to 2019

In 2019, non-profit organizations (NPOs)—serving households, businesses and governments—employed 2.5 million people, representing 12.8% of all jobs in Canada. The employment share ranged between 12.4% and 12.8%, increasing during the 2010-to-2019 period.

While the economic and social landscape of Canada is very different at the time of this release than it was in 2019, these data provide a valuable baseline to better understand the potential impacts of COVID-19 in later reference years.


https://learninghub.prospercanada.org/wp-content/uploads/2020/09/stats-can-logo.png 152 225 Carrie Wong https://learninghub.prospercanada.org/wp-content/uploads/2018/01/Prosper_Canada_Hub_weblogo.png Carrie Wong2021-05-25 11:37:582021-05-25 11:37:58Non-Profit Organizations and Volunteering Satellite Account: Human Resources Module, 2010 to 2019

Employment Insurance, February 2021

February Employment Insurance (EI) statistics reflect labour market conditions as of the week of February 14 to 20.

Ahead of the February reference week, non-essential businesses, cultural and recreation facilities, and in-person dining reopened in many provinces, subject to capacity limits and various other public health requirements. Public health measures were relaxed in Quebec, Alberta, Nova Scotia and New Brunswick on February 8, although a curfew remained in effect in Quebec. Measures were loosened in many regions of Ontario on February 10 and 15, although stay-at-home orders remained in place in the health regions of Toronto, Peel, York and North Bay Parry Sound. In Manitoba, various measures were eased on February 12. In contrast, Newfoundland and Labrador reintroduced a lockdown on February 12, requiring the widespread closure of non-essential businesses and services.


https://learninghub.prospercanada.org/wp-content/uploads/2021/04/statscan-EI-feb2021.png 152 225 Carrie Wong https://learninghub.prospercanada.org/wp-content/uploads/2018/01/Prosper_Canada_Hub_weblogo.png Carrie Wong2021-04-30 18:11:562021-04-30 18:11:56Employment Insurance, February 2021

Study: A labour market snapshot of Black Canadians during the pandemic

In the context of the COVID-19 pandemic, many Canadians, including Black Canadians, have experienced significant economic hardship, while others put themselves at risk through their work in essential industries such as health care and social assistance.

Statistics Canada looked at how the 1 million Black Canadians aged 15 to 69 are faring in the labour market during one of the most disruptive times in our economic history. Analysis of the recent labour market situation of population groups designated as visible minorities is now possible as a result of a new question added to the Labour Force Survey (LFS) in July 2020.

Unless otherwise stated, all data in this release are unadjusted for seasonality and are based on three-month averages ending in January 2021.


https://learninghub.prospercanada.org/wp-content/uploads/2020/09/stats-can-logo.png 152 225 Carrie Wong https://learninghub.prospercanada.org/wp-content/uploads/2018/01/Prosper_Canada_Hub_weblogo.png Carrie Wong2021-04-09 11:35:542021-04-09 11:35:54Study: A labour market snapshot of Black Canadians during the pandemic

Aboriginal Peoples Survey: Data tables, 2017

New data tables on the labour activities of Indigenous Peoples are now available.

Data are from the 2017 Aboriginal Peoples Survey and include information on labour force status, job satisfaction, skills training, skills that limit job opportunities, job permanency, part-time or full-time job status, mismatch of skills for current job, disability status and disability severity class, by Indigenous identity, age group and sex.

Data are available for Canada, the provinces (Atlantic provinces combined) and the territories.


https://learninghub.prospercanada.org/wp-content/uploads/2020/09/stats-can-logo.png 152 225 Carrie Wong https://learninghub.prospercanada.org/wp-content/uploads/2018/01/Prosper_Canada_Hub_weblogo.png Carrie Wong2021-04-09 11:12:422021-04-09 11:13:12Aboriginal Peoples Survey: Data tables, 2017

Longitudinal Immigration Database: Asylum claimant and immigrant economic region tables, 2018

Tables on the income and mobility of immigrants by economic region, and a table on asylum claimant economic outcomes, are now available. These tables use data from the Longitudinal Immigration Database.


https://learninghub.prospercanada.org/wp-content/uploads/2020/09/stats-can-logo.png 152 225 Carrie Wong https://learninghub.prospercanada.org/wp-content/uploads/2018/01/Prosper_Canada_Hub_weblogo.png Carrie Wong2021-04-09 11:07:292021-04-09 11:07:29Longitudinal Immigration Database: Asylum claimant and immigrant economic region tables, 2018

Aspects of quality of employment in Canada, February and March 2020

The labour market in Canada has experienced unprecedented changes over the last 12 months. Entire sectors of the economy have been subject to temporary restrictions on business activities as a result of public health measures aimed at limiting the spread of COVID-19. At the same time, many workers have seen changes in working conditions, such as teleworking, reduced work hours and greater job insecurity.

From mid-February to mid-March 2020, the 2020 Survey on Quality of Employment (SQE) collected information on aspects of job quality in Canada from the perspective of workers. Estimates reflect employment characteristics before the full onset of the COVID-19 pandemic and contribute to establishing a baseline for future analysis of quality of employment in Canada. Unless otherwise stated, the analysis focuses on the 23.5 million workers who were employed in February or March 2020 or who had last worked in 2018 or after, and excludes unpaid family workers.


https://learninghub.prospercanada.org/wp-content/uploads/2020/09/stats-can-logo.png 152 225 Carrie Wong https://learninghub.prospercanada.org/wp-content/uploads/2018/01/Prosper_Canada_Hub_weblogo.png Carrie Wong2021-04-09 11:04:072021-04-09 11:04:07Aspects of quality of employment in Canada, February and March 2020

Longitudinal Immigration Database: Immigrant children and census metropolitan area tables, 2018

The most recent 2018 data from the Longitudinal Immigration Database (IMDB) indicate that immigrant children make a significant contribution to Canadian society and the Canadian economy over time. Although immigrant children (32.2%) are more than twice as likely as non-immigrant children (15.4%) to live in low-income households, factors such as the opportunity to be educated in the Canadian system and an increased proficiency in the official languages help immigrant children attain wages in adulthood similar to those of their Canadian-born peers.

This analysis connects the characteristics of immigrants who came to Canada as children with their adulthood socioeconomic outcomes in 2018, such as participation in postsecondary education and median wages. The IMDB provides a long-term perspective on immigrants and their socioeconomic outcomes in Canada, offering details on how immigration is shaping Canada's future. In addition, these data from 2018 contribute to baseline estimates in preparation for future research on the impact of the COVID-19 pandemic on immigrant children, including immigrant children admitted during the pandemic, their adjustment period and their long-term socioeconomic outcomes in adulthood.


https://learninghub.prospercanada.org/wp-content/uploads/2020/09/stats-can-logo.png 152 225 Carrie Wong https://learninghub.prospercanada.org/wp-content/uploads/2018/01/Prosper_Canada_Hub_weblogo.png Carrie Wong2021-04-09 10:58:312021-04-09 10:58:31Longitudinal Immigration Database: Immigrant children and census metropolitan area tables, 2018

Household economic well-being during the COVID-19 pandemic, experimental estimates, first quarter to third quarter of 2020

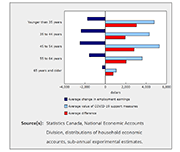
Over the first three quarters of 2020, disposable income for the lowest-income households increased 36.8%, more than for any other households. At the same time, the youngest households recorded the largest gain in their net worth (+9.8%). These changes were driven by unprecedented increases in transfers to households, as the value of government COVID-19 support measures exceeded losses in wages and salaries and self-employment income.

As the pandemic unfolded in Canada, households experienced extraordinary changes in their economic well-being. While quarterly releases of gross domestic product and the national balance sheet provide an aggregate view of these impacts, new experimental sub-annual distributions of household economic accounts (DHEA), released today, provide insight into how the pandemic and the associated government support measures have affected the economic well-being of different groups of households in Canada.


https://learninghub.prospercanada.org/wp-content/uploads/2021/03/statscan-householdeconomicwellbeingCOVID19.png 152 225 Carrie Wong https://learninghub.prospercanada.org/wp-content/uploads/2018/01/Prosper_Canada_Hub_weblogo.png Carrie Wong2021-03-22 18:01:542021-03-22 18:01:54Household economic well-being during the COVID-19 pandemic, experimental estimates, first quarter to third quarter of 2020

Low income measure (LIM) thresholds by income source and household size

Low income measure (LIM) thresholds by household size for market income, total income and after-tax income, in current and constant dollars, annual.


https://learninghub.prospercanada.org/wp-content/uploads/2020/09/stats-can-logo.png 152 225 Carrie Wong https://learninghub.prospercanada.org/wp-content/uploads/2018/01/Prosper_Canada_Hub_weblogo.png Carrie Wong2021-03-22 17:41:362021-03-22 17:41:36Low income measure (LIM) thresholds by income source and household size

COVID-19 in Canada: A One-year Update on Social and Economic Impacts

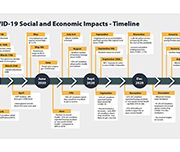
This summary provides highlights on the work the Agency has and is undertaking using existing and new data sources to provide critical insights on the social and economic impacts of COVID-19 on Canadians. It covers the first year of the pandemic from March 2020 to March 2021.


https://learninghub.prospercanada.org/wp-content/uploads/2021/03/statscan-covid-19yearinreview.png 152 225 Carrie Wong https://learninghub.prospercanada.org/wp-content/uploads/2018/01/Prosper_Canada_Hub_weblogo.png Carrie Wong2021-03-22 17:24:212021-03-22 17:24:21COVID-19 in Canada: A One-year Update on Social and Economic Impacts

Study: Association between food insecurity and stressful life events among Canadian adults

The COVID-19 pandemic and the related business closures and lockdowns have given rise to a series of unprecedented socioeconomic and health-related challenges, one of which is increasing food insecurity.

Throughout the pandemic, Statistics Canada has continued to collect and release data on food insecurity in Canada—including exploring the link between food insecurity and mental health, financial stability and Indigenous people living in urban areas.

This study looks at the characteristics of food insecure Canadians, focusing on how losing a job, suffering an injury or illness, or a combination of events can increase the risk of food insecurity. This release compares the food security outcomes of two different subpopulations: those who had experienced a stressful life event and those who had not.


https://learninghub.prospercanada.org/wp-content/uploads/2020/09/stats-can-logo.png 152 225 Carrie Wong https://learninghub.prospercanada.org/wp-content/uploads/2018/01/Prosper_Canada_Hub_weblogo.png Carrie Wong2021-03-22 17:11:512021-03-22 17:11:51Study: Association between food insecurity and stressful life events among Canadian adults

Labour Force Survey, February 2021

February Labour Force Survey (LFS) data reflect labour market conditions during the week of February 14 to 20.

In early February, public health restrictions put in place in late December were eased in many provinces. This allowed for the re-opening of many non-essential businesses, cultural and recreational facilities, and some in-person dining. However, capacity limits and other public health requirements, which varied across jurisdictions, remained in place.

Restrictions were eased to varying degrees in Quebec, Alberta, New Brunswick, and Nova Scotia on February 8, although a curfew remained in effect in Quebec. In Ontario, previous requirements were lifted for many regions on February 10 and 15, while the Toronto, Peel, York and North Bay Parry Sound health regions remained under stay-at-home orders through the reference week. Various measures were eased in Manitoba on February 12.

In contrast, Newfoundland and Labrador re-introduced a lockdown on February 12, requiring the widespread closure of non-essential businesses and services.


https://learninghub.prospercanada.org/wp-content/uploads/2021/03/statscan-labourforcesurveyfeb2021.png 152 225 Carrie Wong https://learninghub.prospercanada.org/wp-content/uploads/2018/01/Prosper_Canada_Hub_weblogo.png Carrie Wong2021-03-22 17:01:362021-03-22 17:01:36Labour Force Survey, February 2021

Diversity of charity and non-profit boards of directors: Overview of the Canadian non-profit sector

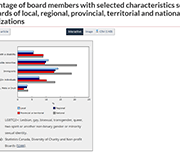
Charities and non-profit organizations play a vital role in supporting and enriching the lives of Canadians. A crowdsourcing survey of individuals involved in the governance of charities and non-profit organizations was conducted from December 4, 2020, to January 18, 2021. The objectives of the survey were to collect timely information on the activities of these organizations and the individuals they serve and to learn more about the diversity of those who serve on their boards of directors. A total of 8,835 individuals completed the survey, 6,170 of whom were board members.


https://learninghub.prospercanada.org/wp-content/uploads/2021/02/statscan-diversitycharity.png 152 225 Carrie Wong https://learninghub.prospercanada.org/wp-content/uploads/2018/01/Prosper_Canada_Hub_weblogo.png Carrie Wong2021-02-19 10:12:262021-02-19 10:12:26Diversity of charity and non-profit boards of directors: Overview of the Canadian non-profit sector

Labour Force Survey, January 2021

After the December Labour Force Survey (LFS) reference week—December 6 to 12—a number of provinces extended public health measures in response to increasing COVID-19 cases. January LFS data reflect the impact of these new restrictions and provide a portrait of labour market conditions as of the week of January 10 to 16.

In Ontario, restrictions already in place for many regions of southern Ontario—including the closure of non-essential retail businesses—were extended to the rest of the province effective December 26. In Quebec, non-essential retail businesses were closed effective December 25 and a curfew implemented on January 14 further affected the operating hours of some businesses.

As of the January reference week, existing public health measures continued in Alberta and Manitoba, including the closure of in-person dining services, recreation facilities and personal care services, as well as restrictions on retail businesses.

Restrictions were eased between the December and January reference weeks in two provinces. In Prince Edward Island, closures of in-person dining and recreational and cultural facilities were lifted on December 18. In Halifax, Nova Scotia, and the surrounding area, restrictions on in-person dining were eased on January 4.


https://learninghub.prospercanada.org/wp-content/uploads/2021/02/statscan-labourforcesurveyjan2021.png 152 225 Carrie Wong https://learninghub.prospercanada.org/wp-content/uploads/2018/01/Prosper_Canada_Hub_weblogo.png Carrie Wong2021-02-19 10:00:462021-03-22 17:49:25Labour Force Survey, January 2021

Canadian Economic News, January 2021 edition

This module provides a concise summary of selected Canadian economic events, as well as international and financial market developments by calendar month. All information presented here is obtained from publicly available news and information sources, and does not reflect any protected information provided to Statistics Canada by survey respondents. This is the issue for January 2021.


https://learninghub.prospercanada.org/wp-content/uploads/2020/09/stats-can-logo.png 152 225 Carrie Wong https://learninghub.prospercanada.org/wp-content/uploads/2018/01/Prosper_Canada_Hub_weblogo.png Carrie Wong2021-02-19 09:52:142021-02-19 09:52:14Canadian Economic News, January 2021 edition

Income and mobility of immigrants, 2018

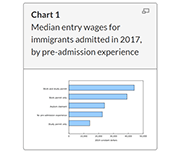
The COVID-19 pandemic has affected many aspects of Canadian immigration, including reduced permanent resident admissions and lower labour market outcomes. This article presents the latest economic and mobility outcomes of immigrants admitted to Canada using data from the 2019 Longitudinal Immigration Database, and provides baseline estimates prior to the pandemic for future analyses.

In recent years, the profile of immigrants admitted to Canada has changed. The median entry wage for immigrants admitted to Canada in 2017 was the highest to date, reaching $30,100 in 2018.

This value surpassed the previous high of $26,500 for 2017 outcomes of immigrants admitted in 2016. These new data also highlight a decreasing gap between the immigrant median entry wage and the Canadian median wage ($37,400). Factors such as pre-admission experience, knowledge of official languages, and category of admission, among other socioeconomic characteristics, could contribute to the rise in median entry wage compared with previous admission years.


https://learninghub.prospercanada.org/wp-content/uploads/2021/02/statscan-incomemobilityimmigrants2018.png 152 225 Carrie Wong https://learninghub.prospercanada.org/wp-content/uploads/2018/01/Prosper_Canada_Hub_weblogo.png Carrie Wong2021-02-19 09:37:362021-03-09 10:13:16Income and mobility of immigrants, 2018

Statistic Canada’s Longitudinal Immigration Database: Birth area and income table, 2018

Statistics Canada's Longitudinal Immigration Database (IMDB) Interactive Application has been updated to include data on citizenship intake rates and income by birth area, sex, pre-admission experience and admission category. This table includes income measures up to 2018 for immigrants admitted to Canada since 2008.


https://learninghub.prospercanada.org/wp-content/uploads/2021/02/statscan-immigrationincomedata.png 152 225 Carrie Wong https://learninghub.prospercanada.org/wp-content/uploads/2018/01/Prosper_Canada_Hub_weblogo.png Carrie Wong2021-02-18 18:22:092021-02-18 18:24:12Statistic Canada’s Longitudinal Immigration Database: Birth area and income table, 2018

One in five Canadians with mental health-related disabilities lives in core housing need

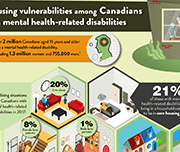
Canadians with mental health-related disabilities were more than twice as likely as those without disabilities to live in households considered to be in core housing need in 2017. Canadians with mental health-related disabilities were also more likely than those without disabilities to live alone, to rent their homes and to live in subsidized housing, according to the 2017 Canadian Survey on Disability (CSD).

The Public Health Agency of Canada (PHAC) has identified those living with pre-existing mental health-related disabilities as a particularly vulnerable population because of the impacts of isolation and disruptions to mental health-related services during the COVID-19 pandemic. A recent crowdsourcing survey by Statistics Canada found that almost three-quarters (73%) of participants with mental health-related disabilities stated that their mental health had worsened since the beginning of the pandemic. In addition, PHAC has indicated that those living with inadequate or unsuitable housing are also more vulnerable during the pandemic and are at higher risk of contracting COVID-19.

This infographic presents pre-existing living situations and housing conditions among Canadians with mental health-related disabilities that may put them at greater risk of contracting COVID-19, as well as the emotional and psychosocial impacts of living through a pandemic.


https://learninghub.prospercanada.org/wp-content/uploads/2021/02/statscan-housingmentalhealth.png 152 225 Carrie Wong https://learninghub.prospercanada.org/wp-content/uploads/2018/01/Prosper_Canada_Hub_weblogo.png Carrie Wong2021-02-05 10:44:352021-02-05 10:44:35One in five Canadians with mental health-related disabilities lives in core housing need

Statistics on Indigenous peoples

This data hub includes data on the following subjects:

  • Crime and victimization
  • Demographic characteristics and Indigenous groups
  • Education, learning and skills
  • Health and well-being
  • Income and spending
  • Indigenous children
  • Indigenous population profiles
  • Labour and employment
  • Language and culture
  • Living arrangements and housing
  • Other content related to Indigenous peoples


https://learninghub.prospercanada.org/wp-content/uploads/2021/01/statscan-indigenousdata.png 152 225 Carrie Wong https://learninghub.prospercanada.org/wp-content/uploads/2018/01/Prosper_Canada_Hub_weblogo.png Carrie Wong2021-01-22 14:15:412021-01-22 14:16:47Statistics on Indigenous peoples

Consumer Price Index Personal Inflation Calculator

This interactive tool created by Statistics Canada allows you to explore your personal rate of inflation, based on the goods and services you consume.

The Consumer Price Index (CPI) is the official measure of inflation in Canada. It is representative of the change in prices experienced by the average Canadian household. However, your personal experience of inflation may not perfectly match the Canadian average due to differences in your spending habits. The Personal Inflation Calculator accounts for those differences and provides a measure of inflation unique to you.


https://learninghub.prospercanada.org/wp-content/uploads/2021/01/statscan-personalinflationcalculator.png 152 225 Carrie Wong https://learninghub.prospercanada.org/wp-content/uploads/2018/01/Prosper_Canada_Hub_weblogo.png Carrie Wong2021-01-22 13:59:392021-01-22 13:59:39Consumer Price Index Personal Inflation Calculator

Labour Force Survey, December 2020

December Labour Force Survey (LFS) results reflect labour market conditions as of the week of December 6 to 12.

As of the reference week, public health measures introduced earlier in the fall remained in place in Manitoba and much of Quebec. These included the closure of many recreation and cultural facilities and in-person dining services, as well as various degrees of restrictions on retail businesses.


https://learninghub.prospercanada.org/wp-content/uploads/2021/01/statscan-labourforcesurveydec.png 152 225 Carrie Wong https://learninghub.prospercanada.org/wp-content/uploads/2018/01/Prosper_Canada_Hub_weblogo.png Carrie Wong2021-01-22 13:47:302021-01-22 13:47:30Labour Force Survey, December 2020

Canadian Economic Dashboard and COVID-19

This dashboard presents selected data that are relevant for monitoring the impacts of COVID-19 on economic activity in Canada. It includes data on a range of monthly indicators - real GDP, consumer prices, the unemployment rate, merchandise exports and imports, retail sales, hours worked and manufacturing sales -- as well as monthly data on aircraft movements, railway carloadings, and travel between Canada and other countries.


https://learninghub.prospercanada.org/wp-content/uploads/2021/01/stats-can-dashboard.png 152 225 Carrie Wong https://learninghub.prospercanada.org/wp-content/uploads/2018/01/Prosper_Canada_Hub_weblogo.png Carrie Wong2021-01-04 17:31:032021-01-04 17:31:03Canadian Economic Dashboard and COVID-19

Gender Results Framework: Data table on core housing need

Statistics Canada's Centre for Gender, Diversity and Inclusion Statistics has released an enhanced data table on the topic of core housing need. These statistics will be used by the Gender Results Framework, a whole-of-government tool designed to track gender equality in Canada.

Using data from the 2006 Census of Population, the 2016 Census of Population and the 2011 National Household Survey, the table shows the proportion of the population in core housing need by selected economic family characteristics.

This table includes a breakdown by province and territory, age group as well as other demographic characteristics such as population groups designated as visible minorities and Indigenous identity.


https://learninghub.prospercanada.org/wp-content/uploads/2020/09/stats-can-logo.png 152 225 Carrie Wong https://learninghub.prospercanada.org/wp-content/uploads/2018/01/Prosper_Canada_Hub_weblogo.png Carrie Wong2020-12-17 17:15:112020-12-17 17:15:11Gender Results Framework: Data table on core housing need

A profile of Canadians with a mobility disability and groups designated as visible minorities with a disability

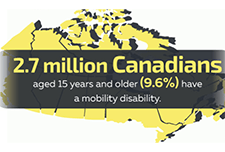
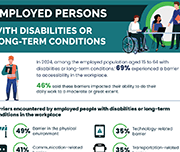
Results from the 2017 Canadian Survey of Disability (CSD) have shown that over half of Canadians with a mobility disability need at least one workplace accommodation. Among population groups designated as visible minorities who have a disability, one-quarter considered themselves to be disadvantaged in employment because of their condition.

In recognition of the International Day of Persons with Disabilities, Statistics Canada released three new data products based on findings from the 2017 CSD. One infographic focuses on disabilities related to mobility and another takes a look at visible minorities with disabilities. In addition, two data tables, on industry and occupation of those with and without disabilities, are now available.


https://learninghub.prospercanada.org/wp-content/uploads/2020/12/stats-can-disability-survey-infographic.png 152 225 Carrie Wong https://learninghub.prospercanada.org/wp-content/uploads/2018/01/Prosper_Canada_Hub_weblogo.png Carrie Wong2020-12-11 11:36:522020-12-11 11:36:52A profile of Canadians with a mobility disability and groups designated as visible minorities with a disability

Labour Force Survey, November 2020

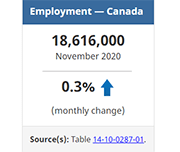
November Labour Force Survey (LFS) results reflect labour market conditions as of the week of November 8 to 14.

In September and October, many provinces began introducing targeted public health measures in response to rising COVID-19 numbers. In early November, restrictions related to indoor dining and fitness facilities were eased in Ontario, while in Manitoba new measures affecting restaurants, recreational facilities and retail businesses were introduced. Much of Quebec remained at the "red" alert level in November, leading to the ongoing closure of indoor dining and many recreational and cultural facilities.


https://learninghub.prospercanada.org/wp-content/uploads/2020/12/stats-can-labour-force-nov-2020.png 152 225 Carrie Wong https://learninghub.prospercanada.org/wp-content/uploads/2018/01/Prosper_Canada_Hub_weblogo.png Carrie Wong2020-12-11 11:25:222020-12-11 11:25:22Labour Force Survey, November 2020

Labour Force Survey, October 2020

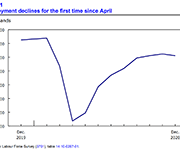
October Labour Force Survey (LFS) results reflect labour market conditions as of the week of October 11 to 17. By then, several provinces had tightened public health measures in response to a spike in COVID-19 cases. Unlike the widespread economic shutdown implemented in March and April, these measures were targeted at businesses where the risk of COVID transmission is thought to be greater, including indoor restaurants and bars and recreational facilities.

Employment increased by 84,000 (+0.5%) in October, after growing by an average of 2.7% per month since May. The unemployment rate was 8.9%, little changed from September.

Employment increases in several industries were partially offset by a decrease of 48,000 in the accommodation and food services industry, largely in Quebec.


https://learninghub.prospercanada.org/wp-content/uploads/2020/09/stats-can-logo.png 152 225 Carrie Wong https://learninghub.prospercanada.org/wp-content/uploads/2018/01/Prosper_Canada_Hub_weblogo.png Carrie Wong2020-11-11 12:04:522020-11-11 12:04:52Labour Force Survey, October 2020

Labour Force Survey, September 2020

The September Labour Force Survey (LFS) results reflect labour market conditions as of the week of September 13 to 19. At the beginning of September, as Canadian families adapted to new back-to-school routines, public health restrictions had been substantially eased across the country and many businesses and workplaces had re-opened. Throughout the month, some restrictions were re-imposed in response to increases in the number of COVID-19 cases. In British Columbia, new rules and guidelines related to bars and restaurants were implemented on September 8. In Ontario, limits on social gatherings were tightened for the hot spots of Toronto, Peel and Ottawa on September 17 and for the rest of the province on September 19.


https://learninghub.prospercanada.org/wp-content/uploads/2020/09/stats-can-logo.png 152 225 Carrie Wong https://learninghub.prospercanada.org/wp-content/uploads/2018/01/Prosper_Canada_Hub_weblogo.png Carrie Wong2020-11-11 11:59:312020-11-11 11:59:31Labour Force Survey, September 2020

How are Canadians with long-term conditions and disabilities impacted by the COVID-19 pandemic?

This infographic focuses on self-reported health, unmet needs for services and therapies, and difficulties meeting certain financial obligations and essential needs since the start of the COVID-19 pandemic among participants aged 15 and older living with long-term conditions and disabilities. Results are based on the recent Statistics Canada crowdsourcing data collection completed by over 13,000 Canadians with long-term conditions or disabilities between June 23 and July 6, 2020.


https://learninghub.prospercanada.org/wp-content/uploads/2020/10/stats-can-disability-covid-19-infographic.png 152 225 Carrie Wong https://learninghub.prospercanada.org/wp-content/uploads/2018/01/Prosper_Canada_Hub_weblogo.png Carrie Wong2020-10-27 11:49:062020-10-27 11:49:06How are Canadians with long-term conditions and disabilities impacted by the COVID-19 pandemic?

Data literacy training

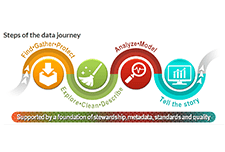
Statistics Canada presents a learning catalogue to share knowledge on data literacy. Data literacy is the ability to derive meaningful information from data. It focuses on the competencies involved in working with data including the knowledge and skills to read, analyze, interpret, visualize and communicate data as well as understand the use of data in decision-making.

Their aim is to provide learners with information on the basic concepts and skills with regard to a range of data literacy topics. The training is aimed at those who are new to data or those who have some experience with data but may need a refresher or want to expand their knowledge.


https://learninghub.prospercanada.org/wp-content/uploads/2020/10/stats-can-data-literacy.png 152 225 Carrie Wong https://learninghub.prospercanada.org/wp-content/uploads/2018/01/Prosper_Canada_Hub_weblogo.png Carrie Wong2020-10-27 09:15:232020-10-27 09:15:23Data literacy training

Growing up in a lower-income family can have lasting effects

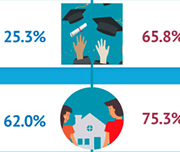
The infographic "Intergenerational income mobility: The lasting effects of growing up in a lower-income family" based on the article "Exploration of the role of education in intergenerational income mobility in Canada: Evidence from the Longitudinal and International Study of Adults," published in the Canadian Public Policy journal presents the effects of growing up in a lower-income family based on a longitudinal study of a cohort of Canadians born between 1963 and 1979.


https://learninghub.prospercanada.org/wp-content/uploads/2020/09/stats-can-effects-of-low-income-infographic.png 152 225 Carrie Wong https://learninghub.prospercanada.org/wp-content/uploads/2018/01/Prosper_Canada_Hub_weblogo.png Carrie Wong2020-09-22 19:00:022020-10-06 11:06:42Growing up in a lower-income family can have lasting effects

Labour Force Survey, August 2020

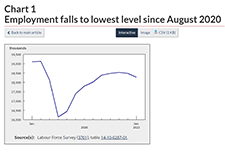
The August Labour Force Survey (LFS) results reflect labour market conditions as of the week of August 9 to 15, five months following the onset of the COVID-19 economic shutdown. By mid-August, public health restrictions had substantially eased across the country and more businesses and workplaces had re-opened.


https://learninghub.prospercanada.org/wp-content/uploads/2020/09/stats-can-logo.png 152 225 Carrie Wong https://learninghub.prospercanada.org/wp-content/uploads/2018/01/Prosper_Canada_Hub_weblogo.png Carrie Wong2020-09-22 18:46:272020-09-22 18:46:55Labour Force Survey, August 2020

Dimensions of Poverty Hub

The Dimensions of Poverty Hub, sponsored by Employment and Social Development Canada (ESDC), enables Canadians to track progress on poverty reduction. The updates as of September 2020 include poverty statistics based upon the new 2018-base Market Basket Measure (MBM).


https://learninghub.prospercanada.org/wp-content/uploads/2020/09/stats-can-dimensions-of-poverty-hub.png 152 225 Carrie Wong https://learninghub.prospercanada.org/wp-content/uploads/2018/01/Prosper_Canada_Hub_weblogo.png Carrie Wong2020-09-22 18:36:042020-09-22 18:37:35Dimensions of Poverty Hub

Gender, Diversity and Inclusion Statistics Hub

Launched by the Centre for Gender, Diversity and Inclusion Statistics (CGDIS), the Gender, Diversity and Inclusion Hub focuses on disaggregated data by gender and other identities to support evidence-based policy development and decision making. 


https://learninghub.prospercanada.org/wp-content/uploads/2020/09/stats-can-CGDIS.png 152 225 Carrie Wong https://learninghub.prospercanada.org/wp-content/uploads/2018/01/Prosper_Canada_Hub_weblogo.png Carrie Wong2020-09-22 18:10:452020-09-22 18:10:45Gender, Diversity and Inclusion Statistics Hub

Impacts of COVID-19 on persons with disabilities

This article provides a general snapshot of the employment and income impacts of COVID-19 on survey participants aged 15 to 64 living with long-term conditions and disabilities.


https://learninghub.prospercanada.org/wp-content/uploads/2020/09/stats-can-logo.png 152 225 Carrie Wong https://learninghub.prospercanada.org/wp-content/uploads/2018/01/Prosper_Canada_Hub_weblogo.png Carrie Wong2020-09-18 16:56:332020-09-18 16:57:13Impacts of COVID-19 on persons with disabilities

Canadian Health Survey on Children and Youth, 2019

The current pandemic has reinforced the need for additional information on the health of Canadian children and youth, particularly for those younger than age 12.

Results from the new Canadian Health Survey on Children and Youth (CHSCY) indicate that 4% of children and youth aged 1 to 17, as reported by their parents, had fair or poor mental health in 2019, one year prior to the pandemic. The survey also found that poor mental health among children and youth was associated with adverse health and social outcomes, such as lower grades and difficulty making friends.

Recently released crowdsourced data suggest that the perceived mental health of Canadian youth has declined during the pandemic, with over half (57%) of participants aged 15 to 17 reporting that their mental health was somewhat worse or much worse than it was prior to the implementation of physical distancing measures.


https://learninghub.prospercanada.org/wp-content/uploads/2020/09/stats-can-logo.png 152 225 Carrie Wong https://learninghub.prospercanada.org/wp-content/uploads/2018/01/Prosper_Canada_Hub_weblogo.png Carrie Wong2020-09-01 12:22:002020-09-01 12:22:00Canadian Health Survey on Children and Youth, 2019

Labour Force Survey in brief: Interactive app

Part of the Canadian Labour Market Observatory, this interactive data visualization application showcases publicly available labour market information. The fully interactive applications allow Canadians to quickly and easily personalize the information in a way that is relevant to them and their interests.


https://learninghub.prospercanada.org/wp-content/uploads/2020/07/stats-can-labour-force-app.png 152 225 Carrie Wong https://learninghub.prospercanada.org/wp-content/uploads/2018/01/Prosper_Canada_Hub_weblogo.png Carrie Wong2020-07-21 11:53:242020-07-21 15:47:29Labour Force Survey in brief: Interactive app

Infographic: COVID-19 and the labour market in June 2020

This infographic displays information on the Canadian labour market in June 2020 as a result of COVID-19.


https://learninghub.prospercanada.org/wp-content/uploads/2020/07/stats-can-labour-force-june-2020-infographic.png 152 225 Carrie Wong https://learninghub.prospercanada.org/wp-content/uploads/2018/01/Prosper_Canada_Hub_weblogo.png Carrie Wong2020-07-21 11:45:542020-07-21 16:34:16Infographic: COVID-19 and the labour market in June 2020

Labour Force Survey, June 2020

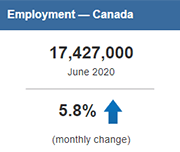
Labour Force Survey (LFS) results for June reflect labour market conditions as of the week of June 14 to June 20. A series of survey enhancements continued in June, including additional questions on working from home, difficulty meeting financial needs, and receipt of federal COVID-19 assistance payments. New questions were added to measure the extent to which COVID-19-related health risks are being mitigated through workplace adaptations and protective measures.


https://learninghub.prospercanada.org/wp-content/uploads/2020/07/stats-can-employment-june-2020.png 152 225 Carrie Wong https://learninghub.prospercanada.org/wp-content/uploads/2018/01/Prosper_Canada_Hub_weblogo.png Carrie Wong2020-07-21 11:33:132020-07-21 15:58:44Labour Force Survey, June 2020

Infographic: The impact of the COVID-19 pandemic on Canadian families and children

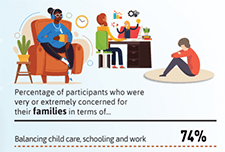
This infographic describes parents' experiences during the COVID-19 pandemic including balancing work and schooling, their children's activities and parents' concerns.


https://learninghub.prospercanada.org/wp-content/uploads/2020/07/stats-can-impact-of-covid19-on-families.png 152 225 Carrie Wong https://learninghub.prospercanada.org/wp-content/uploads/2018/01/Prosper_Canada_Hub_weblogo.png Carrie Wong2020-07-21 11:17:182020-07-21 16:04:22Infographic: The impact of the COVID-19 pandemic on Canadian families and children

Impacts of COVID-19 on Canadian families and children

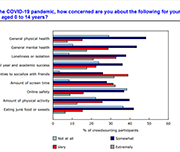
The COVID-19 pandemic has dramatically altered the way of life for Canadian families, parents and children. Because of physical distancing and employment impacts, parents have altered their usual routines and supports, and many children and families have been isolated in their homes for months. Children, in particular, may not have left their homes or seen any friends or family members other than their parents for an extended period, since children do not typically have to leave their homes for essential services. However, the impact of the pandemic on families has yet to be described. The purpose of this report is to provide a snapshot of the experiences of Canadian parents and families during this unprecedented time.


https://learninghub.prospercanada.org/wp-content/uploads/2020/07/stats-can-impact-of-covid19-on-families1.png 152 225 Carrie Wong https://learninghub.prospercanada.org/wp-content/uploads/2018/01/Prosper_Canada_Hub_weblogo.png Carrie Wong2020-07-21 11:09:162020-07-21 16:09:38Impacts of COVID-19 on Canadian families and children

Volunteering in Canada: Challenges and opportunities during the COVID-19 pandemic

In 2018, over 12.7 million Canadians engaged in formal volunteering, with a total of 1.6 billion hours of their time given to charities, non-profits and community organizations—equivalent to almost 858,000 full-time year-round jobs. Today, Canadians are courageously volunteering in the midst of one of the largest health, economic and social challenges of our lifetime.

The study, based upon the 2018 General Social Survey on Giving, Volunteering and Participating, measures the contributions of those who have given their time. While these data are from prior to the COVID-19 pandemic, they provide insight into challenges and opportunities facing volunteerism in the current situation.


https://learninghub.prospercanada.org/wp-content/uploads/2020/06/afn-wealth-and-health.png 152 225 Carrie Wong https://learninghub.prospercanada.org/wp-content/uploads/2018/01/Prosper_Canada_Hub_weblogo.png Carrie Wong2020-06-30 11:05:452020-06-30 12:23:49Volunteering in Canada: Challenges and opportunities during the COVID-19 pandemic

Infographic: The impact of COVID-19 on the Canadian labour market

This infographic presents information on the impact of COVID-19 on the Canadian labour market, based from the Labour Force Survey conducted each month. Over three million Canadians were affected by job loss or reduced hours.


https://learninghub.prospercanada.org/wp-content/uploads/2020/04/stats-can-covid-labour-market.png 152 225 Carrie Wong https://learninghub.prospercanada.org/wp-content/uploads/2018/01/Prosper_Canada_Hub_weblogo.png Carrie Wong2020-04-22 11:02:312020-06-30 14:36:23Infographic: The impact of COVID-19 on the Canadian labour market

Infographic: How are Canadians coping with the COVID-19 situation?

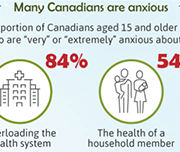
An infographic on the findings from a web panel online survey conducted by Statistics Canada between March 29 and April 3 on how Canadians are responding to the COVID-19 situation. A summary of how many Canadians are feeling anxious, what they are doing during the crisis, and the main precautions that they are taking are presented.


https://learninghub.prospercanada.org/wp-content/uploads/2020/04/stats-can-canadians-coping-w-covid.png 152 225 Carrie Wong https://learninghub.prospercanada.org/wp-content/uploads/2018/01/Prosper_Canada_Hub_weblogo.png Carrie Wong2020-04-22 10:51:532020-06-30 14:41:03Infographic: How are Canadians coping with the COVID-19 situation?

Canadian Perspectives Survey Series 1: Impacts of COVID-19 on job security and personal finances, 2020

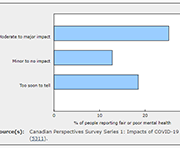
Findings from a web panel survey developed by Statistics Canada on how Canadians are coping with COVID-19. More than 4,600 people in the 10 provinces responded to this survey from March 29 to April 3. In addition to content on the concerns of Canadians and the precautions they took to reduce the risk of exposure to COVID-19, the survey includes questions on work location, perceptions of job security, and the impact of COVID-19 on financial security.


https://learninghub.prospercanada.org/wp-content/uploads/2020/04/stats-can-covid-impact-on-finances.png 148 225 Carrie Wong https://learninghub.prospercanada.org/wp-content/uploads/2018/01/Prosper_Canada_Hub_weblogo.png Carrie Wong2020-04-22 10:42:392020-06-30 14:45:24Canadian Perspectives Survey Series 1: Impacts of COVID-19 on job security and personal finances, 2020

Canadian Income Survey, 2018

This report from Statistics Canada shares data on median after-tax income and overall poverty rate decline based on 2018 data. 

https://learninghub.prospercanada.org/wp-content/uploads/2018/01/Prosper_Canada_Hub_weblogo.png 0 0 Glenna Harris https://learninghub.prospercanada.org/wp-content/uploads/2018/01/Prosper_Canada_Hub_weblogo.png Glenna Harris2020-02-24 11:34:082020-02-24 11:34:08Canadian Income Survey, 2018

Infographic: The Changing Characteristics of Canadian Jobs

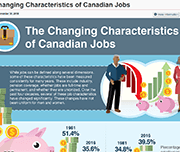
This infographic released by Statistics Canada shows some of the ways the Canadian workforce has changed from 1981 to 2018. Some of these changes include industry, pension coverage, whether jobs are full-time and permanent, and whether they are unionized. These changes have also not been uniform for men and women.


https://learninghub.prospercanada.org/wp-content/uploads/2019/10/stats-can-changing-characteristics-of-canadian-jobs-infographic.png 152 225 Carrie Wong https://learninghub.prospercanada.org/wp-content/uploads/2018/01/Prosper_Canada_Hub_weblogo.png Carrie Wong2019-10-01 14:25:062019-10-01 14:25:06Infographic: The Changing Characteristics of Canadian Jobs

Infographic: New Data on Disability in Canada, 2017

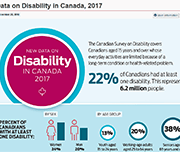
This infographic released from Statistics Canada compiles some of the data collected from the 2017 Canadian Survey on Disability. 22% of Canadians had at least one disability, representing 6.2 million people.


https://learninghub.prospercanada.org/wp-content/uploads/2019/10/stats-can-2017-disability-infographic.png 152 225 Carrie Wong https://learninghub.prospercanada.org/wp-content/uploads/2018/01/Prosper_Canada_Hub_weblogo.png Carrie Wong2019-10-01 14:04:072019-10-01 14:33:15Infographic: New Data on Disability in Canada, 2017

The income of Canadians

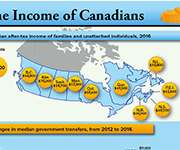
This infographic from Statistics Canada shows the median after-tax income of households, by province, as of 2016. It also shows changes in median government transfers, and number of people living on low incomes according to the after-tax low income measure. 


https://learninghub.prospercanada.org/wp-content/uploads/2019/04/StatsCan-Income.png 150 225 Glenna Harris https://learninghub.prospercanada.org/wp-content/uploads/2018/01/Prosper_Canada_Hub_weblogo.png Glenna Harris2019-04-30 16:09:592019-04-30 16:09:59The income of Canadians

Results from the Survey of Household Spending, 2017 (Infographic)

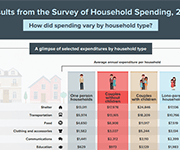
This infographic from Statistics Canada summarizes the results of the Survey of Household Spending, 2017, including average annual expenditures by household type. 


https://learninghub.prospercanada.org/wp-content/uploads/2019/04/StatsCan-Survey.png 150 225 Glenna Harris https://learninghub.prospercanada.org/wp-content/uploads/2018/01/Prosper_Canada_Hub_weblogo.png Glenna Harris2019-04-30 15:57:402019-06-13 10:37:29Results from the Survey of Household Spending, 2017 (Infographic)

Infographic: Labour market outcomes for college and university graduates, 2010 to 2014

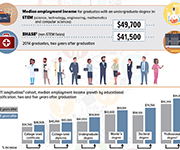
This infographic from Statistics Canada shows the labour market outcomes for college and university graduates between 2010 and 2014. It shows the median employment income achieved by graduates of different education levels, 2 years and 5 years post-graduation. Overall, it shows that people with higher levels of post-secondary education report higher employment income post-graduation. 


https://learninghub.prospercanada.org/wp-content/uploads/2019/04/Infographic-EducationEmployment.png 150 225 Glenna Harris https://learninghub.prospercanada.org/wp-content/uploads/2018/01/Prosper_Canada_Hub_weblogo.png Glenna Harris2019-04-29 16:42:092019-04-29 16:42:09Infographic: Labour market outcomes for college and university graduates, 2010 to 2014

Debt and assets among senior Canadian families, 1999 to 2016

These results are from the new study "Debt and assets among senior Canadian families." released in April 2018. The study examines changes in debt, assets and net worth among Canadian families whose major income earner was 65 years of age or older.

In recent years, household debt has increased. The level of debt and value of assets are especially important for the financial security of seniors. Because income typically declines during the retirement years, seniors often need accumulated assets to finance their consumption, especially if they do not benefit from a private pension plan. Debt can also be particularly problematic for seniors as repayment can be more difficult on a reduced income.


https://learninghub.prospercanada.org/wp-content/uploads/2019/04/StatsCanDebtSeniors-1.png 150 225 Glenna Harris https://learninghub.prospercanada.org/wp-content/uploads/2018/01/Prosper_Canada_Hub_weblogo.png Glenna Harris2019-04-03 11:28:262019-04-03 14:35:50Debt and assets among senior Canadian families, 1999 to 2016

Indebtedness and Wealth Among Canadian Households

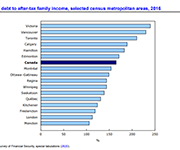
Understanding the health of the balance sheets of Canadian households is a complex issue that continues to generate considerable discussion. A new Statistics Canada study contributes to these discussions by highlighting the extent to which national measures of indebtedness and wealth mask significant variation across the country. The study is largely based on results from the 2016 Survey of Financial Security (SFS), which allow for a detailed profile by census metropolitan area (CMA) and by income groups.


https://learninghub.prospercanada.org/wp-content/uploads/2019/03/StatsCanIndebtedness.png 150 225 Glenna Harris https://learninghub.prospercanada.org/wp-content/uploads/2018/01/Prosper_Canada_Hub_weblogo.png Glenna Harris2019-03-28 15:12:202019-03-28 15:12:20Indebtedness and Wealth Among Canadian Households

Spotlight on Canadians and Debt: Who’s Vulnerable

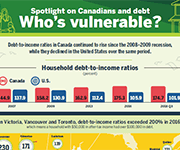
Debt-to-income ratios in Canada have continue to rise since the 2008-2009 recession, especially in urban centres where housing prices have increased over the last few years.

This infographic from Statistics Canada shows where debt-to-income ratios are highest across Canada. 


https://learninghub.prospercanada.org/wp-content/uploads/2019/03/StatsCanDebt2019.png 150 225 Glenna Harris https://learninghub.prospercanada.org/wp-content/uploads/2018/01/Prosper_Canada_Hub_weblogo.png Glenna Harris2019-03-11 14:34:282019-03-11 14:34:28Spotlight on Canadians and Debt: Who’s Vulnerable

Canadian Income Survey, 2015

https://learninghub.prospercanada.org/wp-content/uploads/2018/01/Prosper_Canada_Hub_weblogo.png 0 0 Jenni Bolton https://learninghub.prospercanada.org/wp-content/uploads/2018/01/Prosper_Canada_Hub_weblogo.png Jenni Bolton2018-05-07 12:42:212023-08-03 01:48:30Canadian Income Survey, 2015

Living arrangements of Aboriginal children aged 14 and under

https://learninghub.prospercanada.org/wp-content/uploads/2018/01/Prosper_Canada_Hub_weblogo.png 0 0 John Smith https://learninghub.prospercanada.org/wp-content/uploads/2018/01/Prosper_Canada_Hub_weblogo.png John Smith2017-11-29 09:30:342020-08-20 15:35:09Living arrangements of Aboriginal children aged 14 and under

Canadian Demographics at a Glance – Second edition

https://learninghub.prospercanada.org/wp-content/uploads/2018/01/Prosper_Canada_Hub_weblogo.png 0 0 John Smith https://learninghub.prospercanada.org/wp-content/uploads/2018/01/Prosper_Canada_Hub_weblogo.png John Smith2017-11-29 09:30:342018-01-11 15:52:05Canadian Demographics at a Glance – Second edition

The influence of community well-being on mortality among Registered First Nations people

https://learninghub.prospercanada.org/wp-content/uploads/2018/01/Prosper_Canada_Hub_weblogo.png 0 0 John Smith https://learninghub.prospercanada.org/wp-content/uploads/2018/01/Prosper_Canada_Hub_weblogo.png John Smith2017-11-29 09:30:342023-02-13 15:42:17The influence of community well-being on mortality among Registered First Nations people

The fall and rise of Canada’s top income earners

https://learninghub.prospercanada.org/wp-content/uploads/2018/01/Prosper_Canada_Hub_weblogo.png 0 0 John Smith https://learninghub.prospercanada.org/wp-content/uploads/2018/01/Prosper_Canada_Hub_weblogo.png John Smith2017-11-29 09:30:322018-01-26 13:12:10The fall and rise of Canada’s top income earners

High-income trends among Canadian taxfilers, 2014

https://learninghub.prospercanada.org/wp-content/uploads/2018/01/Prosper_Canada_Hub_weblogo.png 0 0 John Smith https://learninghub.prospercanada.org/wp-content/uploads/2018/01/Prosper_Canada_Hub_weblogo.png John Smith2017-11-29 09:30:212018-03-19 14:12:57High-income trends among Canadian taxfilers, 2014

Canadian Income Survey, 2014

https://learninghub.prospercanada.org/wp-content/uploads/2018/01/Prosper_Canada_Hub_weblogo.png 0 0 John Smith https://learninghub.prospercanada.org/wp-content/uploads/2018/01/Prosper_Canada_Hub_weblogo.png John Smith2017-11-29 09:29:462018-01-11 15:56:54Canadian Income Survey, 2014

2014 Canadian Financial Capability Survey – Retirement planning

https://learninghub.prospercanada.org/wp-content/uploads/2018/01/Prosper_Canada_Hub_weblogo.png 0 0 John Smith https://learninghub.prospercanada.org/wp-content/uploads/2018/01/Prosper_Canada_Hub_weblogo.png John Smith2017-11-29 09:29:462019-07-18 11:12:252014 Canadian Financial Capability Survey – Retirement planning

Family income and income of individuals, related variables: Sub-provincial data, 2014

https://learninghub.prospercanada.org/wp-content/uploads/2018/01/Prosper_Canada_Hub_weblogo.png 0 0 John Smith https://learninghub.prospercanada.org/wp-content/uploads/2018/01/Prosper_Canada_Hub_weblogo.png John Smith2017-11-29 09:29:462018-01-19 13:28:49Family income and income of individuals, related variables: Sub-provincial data, 2014
About Us
Prosper Canada works with partners in all sectors to develop and promote financial policies, programs and resources that transform lives and help Canadians to prosper.
Home
Resources
Toolkits
Discover Library
RDSP Calculator
Bridge to Benefits
Benefits Wayfinder
Training & courses
Online courses
Workshops
Conferences
Webinars
Organization Directory
Tools for Clients
Benefits Wayfinder
Trove
Making the Most of Your Money
My Money in Canada
Toolkits
RDSP Calculator
Stay Informed
Connect with us
© Copyright - Prosper Canada
Copyright Prosper Canada 2023 Privacy Policy | Disclaimer
Scroll to top
Top