Women living in subsidized housing in Canada
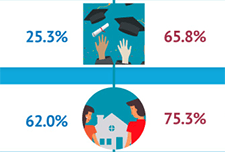
Using data primarily from the 2021 Canadian Housing Survey, this study applies a gender lens to examine the characteristics of Canadians living in subsidized housing. It examines the experiences of renters in subsidized housing and their satisfaction with their dwelling and neighbourhood, drawing comparisons with their counterparts living in non-subsidized rental housing.
Rising prices and the impact on the most financially vulnerable: A profile of those in the bottom family income quintile
This study uses the 2022 Portrait of Canadian Society Survey to examine the impact of rising inflation on the lowest income Canadians. Using multiple pre-pandemic data sources, the study takes a closer look at people living in the bottom family income quintile, examining their family income, debt and assets levels, as well as some indicators of economic hardship.
Survey on savings for persons with disabilities
Residents in Canada who have a severe and prolonged mental or physical disability are eligible for the Disability Tax Credit (DTC). This opens the door to other programs, one of which is the RDSP. Less than one-third of eligible residents in Canada (up to age 59) have a Registered Disability Savings Plan (RDSP)—about 31.5% in 2020. To understand why more eligible residents in Canada do not have an RDSP, Employment and Social Development Canada asked Statistics Canada to conduct the Survey on Savings for Persons with Disabilities. Its goal was to collect data from residents in Canada who were eligible for an RDSP but did not open one. These respondents included both persons with disabilities and family members or others who care for persons with disabilities, since the holder of the plan may not be the same person as the beneficiary in all cases. These data show that, in general, eligible residents in Canada lack information about the RDSP, with many not being aware it exists and a substantial portion reporting not having enough information or money to open one.
Household food insecurity during the COVID-19 pandemic
This study presents data on levels of household food insecurity in the 10 provinces from the September to December 2020 cycle of the Canadian Community Health Survey. In this survey, household food security status within the previous 12 months was measured using a scale that has been routinely used to monitor levels of household food insecurity in Canada. This provided the ability to draw comparisons with pre-pandemic levels. Both before and during the pandemic, certain population groups were more vulnerable to food insecurity in their household. They included people with lower levels of education, those who rent their dwelling, those in lone-parent-led households and those in households reliant on social assistance as their primary source of income. Compared with the pre-pandemic period of 2017/2018, levels of household food insecurity were either unchanged or slightly lower in fall 2020 among groups vulnerable to food insecurity.
Asset resilience of Canadians, 2019
Canadians were more asset resilient just prior to the pandemic than they were at the turn of the millennium. That resilience continues to be tested as we enter the second year of the pandemic. For the purposes of this article, a household is asset resilient when it has liquid assets that are at least equal to the after-tax, low-income measure (LIM-AT) for three months. To be deemed asset resilient in 2019, a person living alone would require liquid assets of approximately $6,000. A household of four would require $12,000 or $3,000 per person to meet the minimum LIM-AT threshold for three months. Recent Statistics Canada data have shown that savings rose sharply during the pandemic, despite the economic upheaval, and that those in the lower income quintiles have seen their income rise as a result of government support programs, such as the Canada Emergency Response Benefit (CERB). Although the data in this release predate the pandemic, they provide an important benchmark to monitor the economic well-being of Canadian households during a time of unprecedented change.
A statistical portrait of Canada’s diverse LGBTQ2+ communities
Statistics Canada presents a demographic and social profile of Canada's diverse LGBTQ2+ communities based on published analyses. Much of the data in this release focus on LGB Canadians (lesbian, gay, bisexual), since Statistics Canada has been collecting detailed information on these communities since 2003.
Low-income persistence in Canada and the provinces
Each year, some Canadians fall into low income, while others rise out of it. For example, over one-quarter (28.1%) of Canadians who were in low income in 2017 had exited it by 2018. This study examines the low income exit rate in Canada—an indicator that can be used to track the amount of time it takes for people to rise out of low income. Although a potential surge in low income in 2020 as a result of the COVID-19 pandemic was avoided by temporary government support programs, the rising long-term unemployment rate in 2021 suggests a possible increase in poverty and low-income persistence in the future.
Workers receiving payments from the Canada Emergency Response Benefit program in 2020
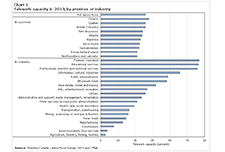
The Canada Emergency Response Benefit program (CERB) was introduced to provide financial support to employees and self-employed workers in Canada who were directly impacted by the COVID-19 pandemic. This article examines the proportion of 2019 workers who received CERB payments in 2020 by various characteristics. CERB take-up rates are presented by industry, earnings group in 2019, sex, age group and province, as well as for population groups designated as visible minorities, immigrants and Indigenous people. Some factors that help explain differences in take-up rates among these groups of workers are also examined.
Household economic well-being during the COVID-19 pandemic, experimental estimates, fourth quarter 2020
A highlight of some of the findings reported in this briefing:
The effects of child tax benefits on the income of single mothers
The financial resources available to families with young children are an important factor affecting child development, and they can have long-term impacts on socioeconomic outcomes in adulthood. This article summarizes the findings of a new study using Statistic Canada’s data and analyzes the effects of expanding child tax benefits on after-tax income among single mothers, in the context of the 2015 reform to the Universal Child Care Benefit (UCCB) and the 2016 introduction of the Canada Child Benefit (CCB).
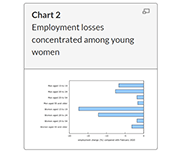
Gender differences in employment one year into the COVID-19 pandemic: An analysis by industrial sector and firm size
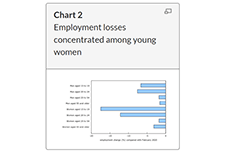
An important aspect of the impact of COVID-19 is its disproportional impact across gender. This Insights article proposes a year-over-year approach that compares employment from March 2020 to February 2021 to their March-2019-to-February-2020 counterparts. It uses the Labour Force Survey to study gender gaps patterns in employment by industrial sector (goods or services) and firm size.
Impacts of the COVID-19 pandemic on productivity growth in Canada
The COVID-19 pandemic has changed how production occurs in the economy in two ways. One is the full or partial closure of non-essential activities such as travel, hospitality, arts and entertainment, personal services, airlines, etc. The other is the widespread shift from in-office work to working from home. This Insights article depicts labour productivity growth in Canada and its sources by industry during the COVID-19 pandemic in order to examine the implications these changes may have had on the productivity performance of the economy.
Economic impact of COVID-19 among Indigenous people
This article uses data from a recent crowdsourcing data initiative to report on the employment and financial impacts of the COVID-19 pandemic on Indigenous participants. It also examines the extent to which Indigenous participants applied for and received federal income support to alleviate these impacts. As Canada gradually enters a recovery phase, the article concludes by reporting on levels of trust among Indigenous participants on decisions to reopen workplaces and public spaces.
A labour market snapshot of South Asian, Chinese and Filipino Canadians during the pandemic
The COVID-19 pandemic has highlighted the varying labour market experiences and outcomes of diverse groups of Canadians. To mark Asian Heritage Month, Statistics Canada is providing a profile of the employment characteristics of the three largest Asian populations in Canada: South Asian, Chinese and Filipino Canadians. Results from the Labour Force Survey (LFS) show that South Asian men are much more likely to be employed than South Asian women, that Chinese Canadians have higher average hourly wages than other visible minority groups, and that Filipino women have among the highest employment rates of all groups, with many working on the front line in the health care sector during the pandemic. Unless otherwise stated, all data in this article reflect the population aged 15 to 69 during the three months ending in April 2021, and are not seasonally adjusted.
Labour Force Survey, April 2021
April Labour Force Survey (LFS) data reflect labour market conditions during the week of April 11 to 17.
The Wealth of Unattached Men and Women Aged 50 and Older, 1999 to 2016
The evolution of the wealth, assets and debts of various groups of Canadians since the late 1990s has been documented in several studies. Yet little is known about the evolution of the wealth holdings of unattached men and women aged 50 and older, who make up a large part of the population. This study assesses how the wealth holdings of unattached men and women aged 50 and older evolved from 1999 to 2016 using data from the Survey of Financial Security of 1999, 2005, 2012 and 2016, and fills this information gap.
Non-Profit Organizations and Volunteering Satellite Account: Human Resources Module, 2010 to 2019
In 2019, non-profit organizations (NPOs)—serving households, businesses and governments—employed 2.5 million people, representing 12.8% of all jobs in Canada. The employment share ranged between 12.4% and 12.8%, increasing during the 2010-to-2019 period. While the economic and social landscape of Canada is very different at the time of this release than it was in 2019, these data provide a valuable baseline to better understand the potential impacts of COVID-19 in later reference years.
Employment Insurance, February 2021
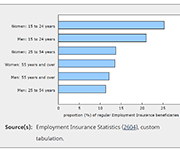
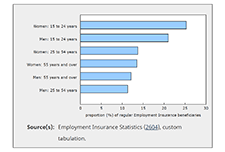
February Employment Insurance (EI) statistics reflect labour market conditions as of the week of February 14 to 20. Ahead of the February reference week, non-essential businesses, cultural and recreation facilities, and in-person dining reopened in many provinces, subject to capacity limits and various other public health requirements. Public health measures were relaxed in Quebec, Alberta, Nova Scotia and New Brunswick on February 8, although a curfew remained in effect in Quebec. Measures were loosened in many regions of Ontario on February 10 and 15, although stay-at-home orders remained in place in the health regions of Toronto, Peel, York and North Bay Parry Sound. In Manitoba, various measures were eased on February 12. In contrast, Newfoundland and Labrador reintroduced a lockdown on February 12, requiring the widespread closure of non-essential businesses and services.
A snapshot: Status First Nations people in Canada
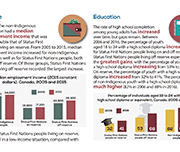
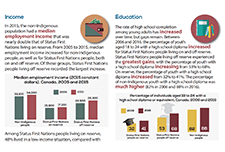
This is a custom report produced in collaboration between the Assembly of First Nations and Statistics Canada. It includes a variety of social and economic statistics for Status First Nations people living on and off reserve and includes comparisons with the non-Indigenous population.
Proposals for a Northern Market Basket Measure and its disposable income
As stated in the Poverty Reduction Act, the Market Basket Measure (MBM) is now Canada’s Official Poverty Line. The Northern Market Basket Measure (MBM-N) is an adaptation of the MBM that reflects life and conditions in two of the territories – Yukon and Northwest TerritoriesNote. As with the MBM, the MBM-N is comprised of five major components: food, clothing, transportation, shelter and other necessities. The MBM-N is intended to capture the spirit of the existing MBM (i.e., represent a modest, basic standard of living) while accounting for adjustments to the contents of the MBM to reflect life in the North. This discussion paper describes a proposed methodology for the five components found in the MBM-N, as well as its disposable income. This discussion paper also provides an opportunity for feedback and comments on the proposed methodology of the MBM-N.
Study: A labour market snapshot of Black Canadians during the pandemic
In the context of the COVID-19 pandemic, many Canadians, including Black Canadians, have experienced significant economic hardship, while others put themselves at risk through their work in essential industries such as health care and social assistance. Statistics Canada looked at how the 1 million Black Canadians aged 15 to 69 are faring in the labour market during one of the most disruptive times in our economic history. Analysis of the recent labour market situation of population groups designated as visible minorities is now possible as a result of a new question added to the Labour Force Survey (LFS) in July 2020. Unless otherwise stated, all data in this release are unadjusted for seasonality and are based on three-month averages ending in January 2021.
Aboriginal Peoples Survey: Data tables, 2017
New data tables on the labour activities of Indigenous Peoples are now available. Data are from the 2017 Aboriginal Peoples Survey and include information on labour force status, job satisfaction, skills training, skills that limit job opportunities, job permanency, part-time or full-time job status, mismatch of skills for current job, disability status and disability severity class, by Indigenous identity, age group and sex. Data are available for Canada, the provinces (Atlantic provinces combined) and the territories.
Longitudinal Immigration Database: Asylum claimant and immigrant economic region tables, 2018
Tables on the income and mobility of immigrants by economic region, and a table on asylum claimant economic outcomes, are now available. These tables use data from the Longitudinal Immigration Database.
Aspects of quality of employment in Canada, February and March 2020
The labour market in Canada has experienced unprecedented changes over the last 12 months. Entire sectors of the economy have been subject to temporary restrictions on business activities as a result of public health measures aimed at limiting the spread of COVID-19. At the same time, many workers have seen changes in working conditions, such as teleworking, reduced work hours and greater job insecurity. From mid-February to mid-March 2020, the 2020 Survey on Quality of Employment (SQE) collected information on aspects of job quality in Canada from the perspective of workers. Estimates reflect employment characteristics before the full onset of the COVID-19 pandemic and contribute to establishing a baseline for future analysis of quality of employment in Canada. Unless otherwise stated, the analysis focuses on the 23.5 million workers who were employed in February or March 2020 or who had last worked in 2018 or after, and excludes unpaid family workers.
Longitudinal Immigration Database: Immigrant children and census metropolitan area tables, 2018
The most recent 2018 data from the Longitudinal Immigration Database (IMDB) indicate that immigrant children make a significant contribution to Canadian society and the Canadian economy over time. Although immigrant children (32.2%) are more than twice as likely as non-immigrant children (15.4%) to live in low-income households, factors such as the opportunity to be educated in the Canadian system and an increased proficiency in the official languages help immigrant children attain wages in adulthood similar to those of their Canadian-born peers. This analysis connects the characteristics of immigrants who came to Canada as children with their adulthood socioeconomic outcomes in 2018, such as participation in postsecondary education and median wages. The IMDB provides a long-term perspective on immigrants and their socioeconomic outcomes in Canada, offering details on how immigration is shaping Canada's future. In addition, these data from 2018 contribute to baseline estimates in preparation for future research on the impact of the COVID-19 pandemic on immigrant children, including immigrant children admitted during the pandemic, their adjustment period and their long-term socioeconomic outcomes in adulthood.
Household economic well-being during the COVID-19 pandemic, experimental estimates, first quarter to third quarter of 2020
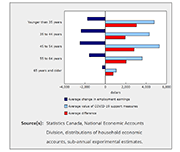
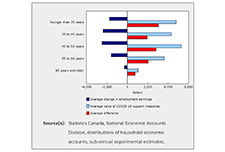
Over the first three quarters of 2020, disposable income for the lowest-income households increased 36.8%, more than for any other households. At the same time, the youngest households recorded the largest gain in their net worth (+9.8%). These changes were driven by unprecedented increases in transfers to households, as the value of government COVID-19 support measures exceeded losses in wages and salaries and self-employment income. As the pandemic unfolded in Canada, households experienced extraordinary changes in their economic well-being. While quarterly releases of gross domestic product and the national balance sheet provide an aggregate view of these impacts, new experimental sub-annual distributions of household economic accounts (DHEA), released today, provide insight into how the pandemic and the associated government support measures have affected the economic well-being of different groups of households in Canada.
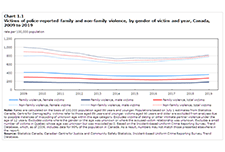
Family violence in Canada: A statistical profile, 2019
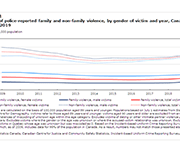
Family violence in Canada: A statistical profile is an annual report produced by the Canadian Centre for Justice and Community Safety Statistics at Statistics Canada as part of the Federal Family Violence Initiative. Since 1998, this report has provided data on the nature and extent of family violence in Canada, as well as an analysis of trends over time. The information presented is used extensively to monitor changes that inform policy makers and the public.
Low income measure (LIM) thresholds by income source and household size
Low income measure (LIM) thresholds by household size for market income, total income and after-tax income, in current and constant dollars, annual.
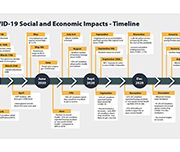
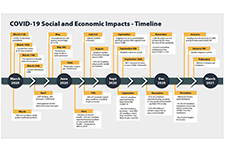
COVID-19 in Canada: A One-year Update on Social and Economic Impacts
This summary provides highlights on the work the Agency has and is undertaking using existing and new data sources to provide critical insights on the social and economic impacts of COVID-19 on Canadians. It covers the first year of the pandemic from March 2020 to March 2021.
Labour Force Survey, February 2021
February Labour Force Survey (LFS) data reflect labour market conditions during the week of February 14 to 20. In early February, public health restrictions put in place in late December were eased in many provinces. This allowed for the re-opening of many non-essential businesses, cultural and recreational facilities, and some in-person dining. However, capacity limits and other public health requirements, which varied across jurisdictions, remained in place. Restrictions were eased to varying degrees in Quebec, Alberta, New Brunswick, and Nova Scotia on February 8, although a curfew remained in effect in Quebec. In Ontario, previous requirements were lifted for many regions on February 10 and 15, while the Toronto, Peel, York and North Bay Parry Sound health regions remained under stay-at-home orders through the reference week. Various measures were eased in Manitoba on February 12. In contrast, Newfoundland and Labrador re-introduced a lockdown on February 12, requiring the widespread closure of non-essential businesses and services.
Trends in Intergenerational Income Mobility and Income Inequality in Canada
In this paper, administrative Canadian tax data are exploited to compute measures of intergenerational income mobility at the national, provincial and territorial levels. This work provides detailed descriptive evidence on trends in social mobility. Five cohorts of Canadians, born between 1963 and 1985, are observed as teens living with their parents and again as adults in their late 20s and early 30s.
Diversity of charity and non-profit boards of directors: Overview of the Canadian non-profit sector
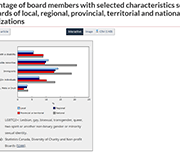
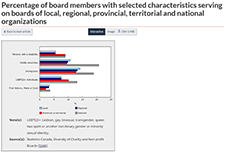
Charities and non-profit organizations play a vital role in supporting and enriching the lives of Canadians. A crowdsourcing survey of individuals involved in the governance of charities and non-profit organizations was conducted from December 4, 2020, to January 18, 2021. The objectives of the survey were to collect timely information on the activities of these organizations and the individuals they serve and to learn more about the diversity of those who serve on their boards of directors. A total of 8,835 individuals completed the survey, 6,170 of whom were board members.
Labour Force Survey, January 2021
After the December Labour Force Survey (LFS) reference week—December 6 to 12—a number of provinces extended public health measures in response to increasing COVID-19 cases. January LFS data reflect the impact of these new restrictions and provide a portrait of labour market conditions as of the week of January 10 to 16. In Ontario, restrictions already in place for many regions of southern Ontario—including the closure of non-essential retail businesses—were extended to the rest of the province effective December 26. In Quebec, non-essential retail businesses were closed effective December 25 and a curfew implemented on January 14 further affected the operating hours of some businesses. As of the January reference week, existing public health measures continued in Alberta and Manitoba, including the closure of in-person dining services, recreation facilities and personal care services, as well as restrictions on retail businesses. Restrictions were eased between the December and January reference weeks in two provinces. In Prince Edward Island, closures of in-person dining and recreational and cultural facilities were lifted on December 18. In Halifax, Nova Scotia, and the surrounding area, restrictions on in-person dining were eased on January 4.
Canadian Economic News, January 2021 edition
This module provides a concise summary of selected Canadian economic events, as well as international and financial market developments by calendar month. All information presented here is obtained from publicly available news and information sources, and does not reflect any protected information provided to Statistics Canada by survey respondents. This is the issue for January 2021.
Income and mobility of immigrants, 2018
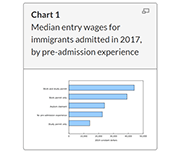
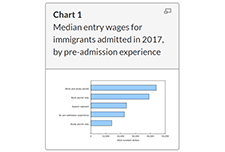
The COVID-19 pandemic has affected many aspects of Canadian immigration, including reduced permanent resident admissions and lower labour market outcomes. This article presents the latest economic and mobility outcomes of immigrants admitted to Canada using data from the 2019 Longitudinal Immigration Database, and provides baseline estimates prior to the pandemic for future analyses. In recent years, the profile of immigrants admitted to Canada has changed. The median entry wage for immigrants admitted to Canada in 2017 was the highest to date, reaching $30,100 in 2018. This value surpassed the previous high of $26,500 for 2017 outcomes of immigrants admitted in 2016. These new data also highlight a decreasing gap between the immigrant median entry wage and the Canadian median wage ($37,400). Factors such as pre-admission experience, knowledge of official languages, and category of admission, among other socioeconomic characteristics, could contribute to the rise in median entry wage compared with previous admission years.
The COVID-19 pandemic and Indigenous people with a disability or long-term condition
This paper uses crowdsourced data to provide an overview of the impacts of the COVID-19 pandemic on the health, service access, and ability to meet basic needs of Indigenous participants with disabilities or long-term conditions. Changes in overall health and mental health are examined by disability type, age group and sex. The most commonly reported service disruptions since the start of the pandemic are also presented. The crowdsourcing data reflected health and other disparities between Indigenous and non-Indigenous participants with a disability or long-term condition. Indigenous participants were more likely to report worsened overall health and mental health, service disruption, and a greater impact on their ability to meet essential needs.
Statistic Canada’s Longitudinal Immigration Database: Birth area and income table, 2018
Statistics Canada's Longitudinal Immigration Database (IMDB) Interactive Application has been updated to include data on citizenship intake rates and income by birth area, sex, pre-admission experience and admission category. This table includes income measures up to 2018 for immigrants admitted to Canada since 2008.
One in five Canadians with mental health-related disabilities lives in core housing need
Canadians with mental health-related disabilities were more than twice as likely as those without disabilities to live in households considered to be in core housing need in 2017. Canadians with mental health-related disabilities were also more likely than those without disabilities to live alone, to rent their homes and to live in subsidized housing, according to the 2017 Canadian Survey on Disability (CSD). The Public Health Agency of Canada (PHAC) has identified those living with pre-existing mental health-related disabilities as a particularly vulnerable population because of the impacts of isolation and disruptions to mental health-related services during the COVID-19 pandemic. A recent crowdsourcing survey by Statistics Canada found that almost three-quarters (73%) of participants with mental health-related disabilities stated that their mental health had worsened since the beginning of the pandemic. In addition, PHAC has indicated that those living with inadequate or unsuitable housing are also more vulnerable during the pandemic and are at higher risk of contracting COVID-19. This infographic presents pre-existing living situations and housing conditions among Canadians with mental health-related disabilities that may put them at greater risk of contracting COVID-19, as well as the emotional and psychosocial impacts of living through a pandemic.
Study: The changing nature of work in Canada amid recent advances in automation technology
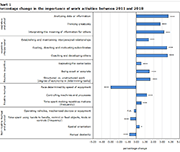
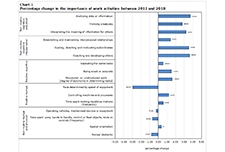
While automation has changed the nature of work in Canada over the past few decades, this change was very gradual, and did not accelerate with the very recent developments in artificial intelligence. The results of this study reveal that the share of Canadians working in managerial, professional and technical occupations increased from 23.8% in 1987 to 31.2% in 2018, while the share employed in service occupations increased more moderately from 19.2% to 21.8% over the same timeframe. Jobs in both of these occupational groups are generally difficult to automate. Meanwhile, the share of workers employed in production, craft, repair and operative occupations (more automatable tasks) went from 29.7% in 1987 to 22.2% in 2018, while the share employed in sales, clerical and administrative support occupations also fell over the period (from 27.3% in 1987 to 24.9% in 2018). These jobs are generally more amenable to automation.
Statistics on Indigenous peoples
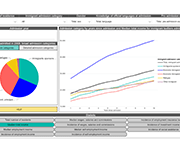
This data hub includes data on the following subjects:
Consumer Price Index Personal Inflation Calculator
This interactive tool created by Statistics Canada allows you to explore your personal rate of inflation, based on the goods and services you consume. The Consumer Price Index (CPI) is the official measure of inflation in Canada. It is representative of the change in prices experienced by the average Canadian household. However, your personal experience of inflation may not perfectly match the Canadian average due to differences in your spending habits. The Personal Inflation Calculator accounts for those differences and provides a measure of inflation unique to you.
Labour Force Survey, December 2020
December Labour Force Survey (LFS) results reflect labour market conditions as of the week of December 6 to 12. As of the reference week, public health measures introduced earlier in the fall remained in place in Manitoba and much of Quebec. These included the closure of many recreation and cultural facilities and in-person dining services, as well as various degrees of restrictions on retail businesses.
Food insecurity and mental health during the COVID-19 pandemic
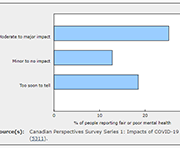
Canadians living in households that experienced food insecurity (insecure or inadequate access to food because of financial constraints) during the early months of the COVID-19 pandemic were significantly more likely to perceive their mental health as fair or poor and to report moderate or severe anxiety symptoms than Canadians in food-secure households. Approximately one in seven Canadians (14.6%) were estimated to live in a food-insecure household in May 2020. This study, released in Health Reports, is the first to examine the association between household food insecurity and self-perceived mental health and anxiety among Canadians during the COVID-19 pandemic. The study also estimated that 9.3% of Canadians living in food-insecure households reported having recently accessed free food or meals from a community organization.
Canadian Economic Dashboard and COVID-19
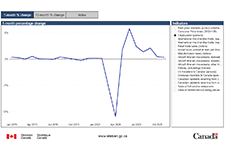
This dashboard presents selected data that are relevant for monitoring the impacts of COVID-19 on economic activity in Canada. It includes data on a range of monthly indicators - real GDP, consumer prices, the unemployment rate, merchandise exports and imports, retail sales, hours worked and manufacturing sales -- as well as monthly data on aircraft movements, railway carloadings, and travel between Canada and other countries.
Inter-generational comparisons of household economic well-being, 1999 to 2019
This study of data from the Distributions of Household Economic Accounts compares households' economic well-being from a macro-economic accounts perspective, as measured by net saving and net worth for each generation when the major income earner for a household in one generation reached the same point in the life cycle as the major income earner for a household in another generation. The study finds that while younger generations have higher disposable income and higher consumption expenditure than older generations when they reached the same age, their net saving is relatively similar. As well, younger generations' economic well-being may be more at risk due to the COVID-19 pandemic since they depend more on employment as a primary source of income, they have higher debt relative to income, and they have less equity in financial and real estate assets from which to draw upon when needed.
Gender Results Framework: Data table on core housing need
Statistics Canada's Centre for Gender, Diversity and Inclusion Statistics has released an enhanced data table on the topic of core housing need. These statistics will be used by the Gender Results Framework, a whole-of-government tool designed to track gender equality in Canada. Using data from the 2006 Census of Population, the 2016 Census of Population and the 2011 National Household Survey, the table shows the proportion of the population in core housing need by selected economic family characteristics. This table includes a breakdown by province and territory, age group as well as other demographic characteristics such as population groups designated as visible minorities and Indigenous identity.
A profile of Canadians with a mobility disability and groups designated as visible minorities with a disability
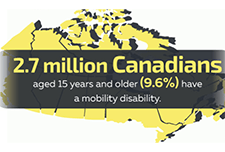
Results from the 2017 Canadian Survey of Disability (CSD) have shown that over half of Canadians with a mobility disability need at least one workplace accommodation. Among population groups designated as visible minorities who have a disability, one-quarter considered themselves to be disadvantaged in employment because of their condition. In recognition of the International Day of Persons with Disabilities, Statistics Canada released three new data products based on findings from the 2017 CSD. One infographic focuses on disabilities related to mobility and another takes a look at visible minorities with disabilities. In addition, two data tables, on industry and occupation of those with and without disabilities, are now available.
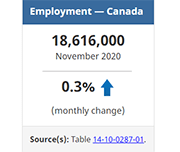
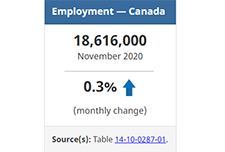
Labour Force Survey, November 2020
November Labour Force Survey (LFS) results reflect labour market conditions as of the week of November 8 to 14. In September and October, many provinces began introducing targeted public health measures in response to rising COVID-19 numbers. In early November, restrictions related to indoor dining and fitness facilities were eased in Ontario, while in Manitoba new measures affecting restaurants, recreational facilities and retail businesses were introduced. Much of Quebec remained at the "red" alert level in November, leading to the ongoing closure of indoor dining and many recreational and cultural facilities.
The long-term labour market integration of refugee claimants who became permanent residents in Canada
Although refugee claimants seek asylum in Canada for humanitarian reasons, their labour market outcomes play a crucial role in their successful integration, which is why it is important to monitor the degree of labour market success achieved by refugee claimants. This study compares the long-term labour market outcomes of refugee claimants who eventually became permanent residents in Canada (RC-PRs) with those of government-assisted refugees (GARs) and privately sponsored refugees (PSRs), as well as with refugee claimants who did not become permanent residents in Canada (RC-NPRs).
Labour Force Survey, October 2020
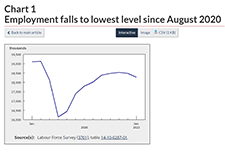
October Labour Force Survey (LFS) results reflect labour market conditions as of the week of October 11 to 17. By then, several provinces had tightened public health measures in response to a spike in COVID-19 cases. Unlike the widespread economic shutdown implemented in March and April, these measures were targeted at businesses where the risk of COVID transmission is thought to be greater, including indoor restaurants and bars and recreational facilities. Employment increased by 84,000 (+0.5%) in October, after growing by an average of 2.7% per month since May. The unemployment rate was 8.9%, little changed from September. Employment increases in several industries were partially offset by a decrease of 48,000 in the accommodation and food services industry, largely in Quebec.
Labour Force Survey, September 2020
The September Labour Force Survey (LFS) results reflect labour market conditions as of the week of September 13 to 19. At the beginning of September, as Canadian families adapted to new back-to-school routines, public health restrictions had been substantially eased across the country and many businesses and workplaces had re-opened. Throughout the month, some restrictions were re-imposed in response to increases in the number of COVID-19 cases. In British Columbia, new rules and guidelines related to bars and restaurants were implemented on September 8. In Ontario, limits on social gatherings were tightened for the hot spots of Toronto, Peel and Ottawa on September 17 and for the rest of the province on September 19.
The changes in health and well-being of Canadians with long-term conditions or disabilities since the start of the COVID-19 pandemic
This article examines how the self-reported health and mental health of people with long-term health conditions or disabilities has changed since the start of the COVID-19 pandemic explored by age, sex and type of reported difficulty. Additionally, the rates of health service disruptions are explored by type of service and region.
How are Canadians with long-term conditions and disabilities impacted by the COVID-19 pandemic?
This infographic focuses on self-reported health, unmet needs for services and therapies, and difficulties meeting certain financial obligations and essential needs since the start of the COVID-19 pandemic among participants aged 15 and older living with long-term conditions and disabilities. Results are based on the recent Statistics Canada crowdsourcing data collection completed by over 13,000 Canadians with long-term conditions or disabilities between June 23 and July 6, 2020.
The Canadian Housing Survey, 2018: Core housing need of renter households living in social and affordable housing
This article provides a high level overview of those living in social and affordable housing by painting a portrait of them based on the results of the 2018 CHS. Socio-demographic and household characteristics are examined using housing indicators such as core housing need.
Data literacy training
Statistics Canada presents a learning catalogue to share knowledge on data literacy. Data literacy is the ability to derive meaningful information from data. It focuses on the competencies involved in working with data including the knowledge and skills to read, analyze, interpret, visualize and communicate data as well as understand the use of data in decision-making. Their aim is to provide learners with information on the basic concepts and skills with regard to a range of data literacy topics. The training is aimed at those who are new to data or those who have some experience with data but may need a refresher or want to expand their knowledge.
Impact of the COVID-19 pandemic on the NEET (not in employment, education or training) indicator, March and April 2020
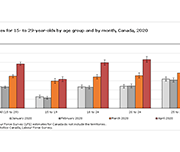
A fact sheet released by Statistics Canada shows that, in March and April 2020, the proportion of young Canadians who were not in employment, education or training (NEET) increased to unprecedented levels. The COVID-19 pandemic—and the public health interventions that were put in place to limit its spread—have affected young people in a number of ways, including high unemployment rates, school closures and education moving online.
Growing up in a lower-income family can have lasting effects
The infographic "Intergenerational income mobility: The lasting effects of growing up in a lower-income family" based on the article "Exploration of the role of education in intergenerational income mobility in Canada: Evidence from the Longitudinal and International Study of Adults," published in the Canadian Public Policy journal presents the effects of growing up in a lower-income family based on a longitudinal study of a cohort of Canadians born between 1963 and 1979.
Labour Force Survey, August 2020
The August Labour Force Survey (LFS) results reflect labour market conditions as of the week of August 9 to 15, five months following the onset of the COVID-19 economic shutdown. By mid-August, public health restrictions had substantially eased across the country and more businesses and workplaces had re-opened.
Low Income Measure: Comparison of Two Data Sources, T1 Family File and 2016 Census of Population
This study looks at the differences in after-tax low income measure (LIM) statistics from two data sources which both use administrative tax data as their principal inputs: the 2016 Census of Population and the T1 Family file (T1FF). It presents a summary of the two data sources and compares after-tax LIM statistics by focussing on unit of analysis, LIM thresholds and the percentage of population below the LIM. The study also explores what factors users may want to consider when choosing one data source over the other.
The mental health of population groups designated as visible minorities in Canada during the COVID-19 pandemic
This article examines the mental health outcomes (i.e., self-rated mental health, change in mental health since physical distancing began, and severity of symptoms consistent with generalized anxiety disorder in the two weeks prior to completing the survey) of participants in a recent crowdsource questionnaire who belong to population groups designated as visible minorities in Canada.
Gender, Diversity and Inclusion Statistics Hub
Launched by the Centre for Gender, Diversity and Inclusion Statistics (CGDIS), the Gender, Diversity and Inclusion Hub focuses on disaggregated data by gender and other identities to support evidence-based policy development and decision making.
Impacts of COVID-19 on persons with disabilities
This article provides a general snapshot of the employment and income impacts of COVID-19 on survey participants aged 15 to 64 living with long-term conditions and disabilities.
Transitions into and out of employment by immigrants during the COVID-19 lockdown and recovery
During the widespread lockdown of economic activities in March and April 2020, the Canadian labour market lost 3 million jobs. From May to July, as many businesses gradually resumed their operations, 1.7 million jobs were recovered. While studies in the United States and Europe suggest that immigrants are often more severely affected by economic downturns than the native born (Borjas and Cassidy 2020; Botric 2018), little is known about whether immigrants and the Canadian born fared differently in the employment disruption induced by the COVID-19 pandemic and, if so, how such differences are related to their socio-demographic and job characteristics. This paper fills this gap by comparing immigrants and the Canadian-born population in their transitions out of employment in the months of heavy contraction and into employment during the months of partial recovery. The analysis is based on individual-level monthly panel data from the Labour Force Survey and focuses on the population aged 20 to 64. Immigrants are grouped into recent immigrants who landed in Canada within 10 years or less, and long-term immigrants who landed in Canada more than 10 years earlier.
Changes in the socioeconomic situation of Canada’s Black population
This study provides disaggregated statistics on the socioeconomic outcomes of the Black population by generation status (and immigrant status), sex and country of origin, and is intended to illustrate and contribute to the relevance of disaggregation in understanding these populations and the diversity of their situation. This study sheds light on some of the issues faced by the Black population and shows differences that exist compared with the rest of the working-age population, by sex, generation and place of origin, from 2001 to 2016.
Canadian Health Survey on Children and Youth, 2019
The current pandemic has reinforced the need for additional information on the health of Canadian children and youth, particularly for those younger than age 12. Results from the new Canadian Health Survey on Children and Youth (CHSCY) indicate that 4% of children and youth aged 1 to 17, as reported by their parents, had fair or poor mental health in 2019, one year prior to the pandemic. The survey also found that poor mental health among children and youth was associated with adverse health and social outcomes, such as lower grades and difficulty making friends. Recently released crowdsourced data suggest that the perceived mental health of Canadian youth has declined during the pandemic, with over half (57%) of participants aged 15 to 17 reporting that their mental health was somewhat worse or much worse than it was prior to the implementation of physical distancing measures.
Expected changes in spending habits during the recovery period
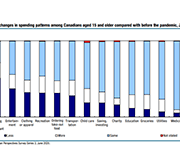
Around mid-June, physical distancing measures began easing across the country, giving Canadians more opportunities to spend money. However, COVID-19 is still with us, shopping habits have changed and there are 1.8 million fewer employed Canadians now than there were prior to the pandemic. How our economy evolves going forward will largely depend upon the spending choices Canadians make over the coming weeks and months. This study presents results from a recent web panel survey conducted in June, looks at how spending habits may change.
Shelters for victims of abuse with ties to Indigenous communities or organizations in Canada, 2017/2018
There were 85 shelters for victims of abuse that had ties to First Nations, Métis or Inuit communities or organizations operating across Canada in 2017/2018. These Indigenous shelters, which are primarily mandated to serve victims of abuse, play an important role for victims leaving abusive situations by providing a safe environment and basic living needs, as well as different kinds of support and outreach services. Over a one-year period, there were more than 10,500 admissions to Indigenous shelters; the vast majority of these admissions were women (63.7%) and their accompanying children (36.1%). This article uses data from the Survey of Residential Facilities for Victims of Abuse (SRFVA). Valuable insight into shelter use in Canada and the challenges that shelters and victims of abuse were facing in 2017/2018 is presented.
Labour Force Survey in brief: Interactive app
Part of the Canadian Labour Market Observatory, this interactive data visualization application showcases publicly available labour market information. The fully interactive applications allow Canadians to quickly and easily personalize the information in a way that is relevant to them and their interests.
Infographic: COVID-19 and the labour market in June 2020
This infographic displays information on the Canadian labour market in June 2020 as a result of COVID-19.
Labour Force Survey, June 2020
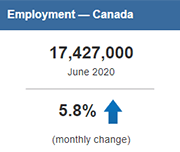
Labour Force Survey (LFS) results for June reflect labour market conditions as of the week of June 14 to June 20. A series of survey enhancements continued in June, including additional questions on working from home, difficulty meeting financial needs, and receipt of federal COVID-19 assistance payments. New questions were added to measure the extent to which COVID-19-related health risks are being mitigated through workplace adaptations and protective measures.
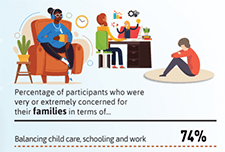
Infographic: The impact of the COVID-19 pandemic on Canadian families and children
This infographic describes parents' experiences during the COVID-19 pandemic including balancing work and schooling, their children's activities and parents' concerns.
Impacts of COVID-19 on Canadian families and children
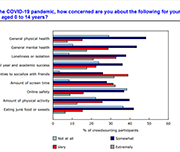
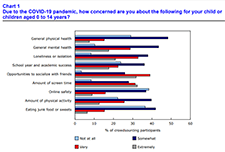
The COVID-19 pandemic has dramatically altered the way of life for Canadian families, parents and children. Because of physical distancing and employment impacts, parents have altered their usual routines and supports, and many children and families have been isolated in their homes for months. Children, in particular, may not have left their homes or seen any friends or family members other than their parents for an extended period, since children do not typically have to leave their homes for essential services. However, the impact of the pandemic on families has yet to be described. The purpose of this report is to provide a snapshot of the experiences of Canadian parents and families during this unprecedented time.
Gender differences in mental health during the COVID-19 pandemic
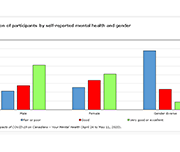
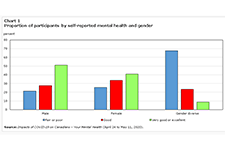
Previous research has demonstrated that the COVID-19 pandemic is negatively affecting the mental health of Canadians. Today, a new study highlights gender differences in the pandemic's impacts on the mental health of participants in a recent crowdsourcing survey, conducted by Statistics Canada from April 24 to May 11, 2020. Around 46,000 Canadian residents participated in this survey. Female participants were more likely than their male counterparts to report "fair" or "poor" self-rated mental health, "somewhat worse" or "much worse" mental health since physical distancing began, and symptoms consistent with moderate or severe generalized anxiety disorder in the two weeks before completing the questionnaire. Female participants were also more likely than male participants to report that their lives were "quite a bit stressful" or "extremely stressful." Gender-diverse participants—that is, participants who did not report their current gender as exclusively female or male—reported poorer mental health outcomes than both female and male participants across all measures.
Economic impact of COVID-19 among visible minority groups
Since visible minorities often have more precarious employment and higher poverty rates than the White population, their ability to adjust to income losses due to work interruptions is likely more limited. Based on a large crowdsourcing data collection initiative, this study examines the economic impact of the COVID-19 pandemic on visible minority groups. Among the crowdsourcing participants who were employed prior to work stoppages, Whites and most visible minority groups reported similar rates of job loss or reduced work hours. However, visible minority participants were more likely than White participants to report that the COVID-19 pandemic had affected their ability to meet financial obligations or essential needs, such as rent or mortgage payments, utilities, and groceries.
Why are lower-income parents less likely to open an RESP account? The roles of literacy, education and wealth
Parents can save for their children's postsecondary education by opening and contributing to a Registered Education Savings Plan (RESP) account, which provides tax and other financial incentives designed to encourage participation (particularly among lower-income families). While the share of parents opening RESP accounts has increased steadily over time, as of 2016, participation rates remained more than twice as high among parents in the top income quartile (top 25%) compared with those in the bottom quartile. This study provides insight into the factors behind the gap in (RESP) participation between higher and lower-income families.
Volunteering in Canada: Challenges and opportunities during the COVID-19 pandemic
In 2018, over 12.7 million Canadians engaged in formal volunteering, with a total of 1.6 billion hours of their time given to charities, non-profits and community organizations—equivalent to almost 858,000 full-time year-round jobs. Today, Canadians are courageously volunteering in the midst of one of the largest health, economic and social challenges of our lifetime. The study, based upon the 2018 General Social Survey on Giving, Volunteering and Participating, measures the contributions of those who have given their time. While these data are from prior to the COVID-19 pandemic, they provide insight into challenges and opportunities facing volunteerism in the current situation.
Inequality in the feasibility of working from home during and after COVID-19
The economic lockdown to stop the spread of COVID-19 has led to steep declines in employment and hours worked for many Canadians. For workers in essential services, in jobs that can be done with proper physical distancing measures or in jobs that can be done from home, the likelihood of experiencing a work interruption during the pandemic is lower than for other workers. To shed light on these issues, this article assesses how the feasibility of working from home varies across Canadian families. It also considers the implications of these differences for family earnings inequality.
Understanding the perceived mental health of Canadians during the COVID-19 pandemic
While the physical health implications of the COVID‑19 pandemic are regularly publicly available, the mental health toll on Canadians is unknown. This article examines the self-perceived mental health of Canadians during the COVID‑19 pandemic and explores associations with various concerns after accounting for socioeconomic and health factors. Just over half of Canadians aged 15 and older (54%) reported excellent or very good mental health during the COVID‑19 pandemic. Several concerns were also associated with mental health. Notably, after considering the effects of socioeconomic and health characteristics, women, youth, individuals with a physical health condition and those who were very or extremely concerned with family stress from confinement were less likely to report excellent or very good mental health.
COVID-19 and support for seniors: Do seniors have people they can depend on during difficult times?
In an effort to avoid the spread of COVID-19, Canadians are engaging in physical distancing to minimize their social contact with others. However, social support systems continue to play an important role during this time. In particular, seniors living in private households may depend on family, friends or neighbours to deliver groceries, medication and other essential items to their homes. This study examines the level of social support reported by seniors living in private households.
Infographic: The impact of COVID-19 on the Canadian labour market
This infographic presents information on the impact of COVID-19 on the Canadian labour market, based from the Labour Force Survey conducted each month. Over three million Canadians were affected by job loss or reduced hours.
Infographic: How are Canadians coping with the COVID-19 situation?
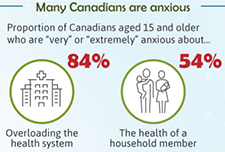
An infographic on the findings from a web panel online survey conducted by Statistics Canada between March 29 and April 3 on how Canadians are responding to the COVID-19 situation. A summary of how many Canadians are feeling anxious, what they are doing during the crisis, and the main precautions that they are taking are presented.
Canadian Perspectives Survey Series 1: Impacts of COVID-19 on job security and personal finances, 2020
Findings from a web panel survey developed by Statistics Canada on how Canadians are coping with COVID-19. More than 4,600 people in the 10 provinces responded to this survey from March 29 to April 3. In addition to content on the concerns of Canadians and the precautions they took to reduce the risk of exposure to COVID-19, the survey includes questions on work location, perceptions of job security, and the impact of COVID-19 on financial security.
Canadian Income Survey, 2018
This report from Statistics Canada shares data on median after-tax income and overall poverty rate decline based on 2018 data.
Defining Disposable income in the Market Basket Measure
This paper discusses the concept of disposable income used in the MBM. Disposable income is a measure of the means available to a Canadian family to meet its basic needs and achieve a modest standard of living. The disposable income of families surveyed in the Canadian Income Survey (CIS) is compared to the cost of the MBM basket for the size of the family and the region, and families with disposable incomes below that cost are deemed to be living in poverty.
Trends in the Citizenship Rate Among New Immigrants to Canada
This Economic Insights article examines trends in the citizenship rate (the percent of immigrants who become Canadian citizens) among recent immigrants who arrived in Canada five to nine years before a given census. The citizenship rate among recent immigrants aged 18 and over peaked in 1996 and declined continuously to 2016. Most of this decline occurred after 2006. The citizenship rate declined most among immigrants with low family income, poor official language skills, and lower levels of education. There was also significant variation in the decline among immigrants from different source regions, with the decline largest among Chinese immigrants.
Infographic: The Changing Characteristics of Canadian Jobs
This infographic released by Statistics Canada shows some of the ways the Canadian workforce has changed from 1981 to 2018. Some of these changes include industry, pension coverage, whether jobs are full-time and permanent, and whether they are unionized. These changes have also not been uniform for men and women.
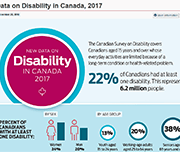
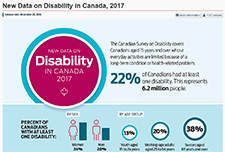
Infographic: New Data on Disability in Canada, 2017
This infographic released from Statistics Canada compiles some of the data collected from the 2017 Canadian Survey on Disability. 22% of Canadians had at least one disability, representing 6.2 million people.
Accessing the Canada Learning Bond: Meeting Identification and Income Eligibility Requirements
Not having a Social Insurance Number (SIN) and not filing taxes may represent challenges to access government programs and supports such as the Canada Education Savings Grant (CESG) and the Canada Learning Bond (CLB). Limited data availability has prevented a full assessment of the extent of these access challenges. This study attempts to address this knowledge gap by analyzing overall differences in SIN possession and tax-filing uptake by family income, levels of parental education, family type and Indigenous identity of the child and age of children using the 2016 Census data augmented with tax-filing and Social Insurance Number possession indicator flags.
Low income among persons with a disability in Canada
Persons with a disability face a higher risk of low income compared to the overall population. This report uses data from the 2014 Longitudinal and International Study of Adults (LISA) to study the relationship between low income and characteristics of people aged 25 to 64 with a disability, including disability type, severity class, age of onset of disability, family composition, and other risk factors associated with low income. It also examines the composition of the low-income population in relation to disability, and provides information on the relationship between employment and low income for this population.
Does education pay? A comparison of earnings by level of education in Canada and its provinces and territories
This report examines the relationship between the earnings of Canadians in the labour market and their post-secondary education credentials. Findings are based upon information gathered from the 2016 Census on adults between the ages of 25 to 64 with different levels of education and working in different parts of the country.
The Effects of Education on Canadians’ Retirement Savings Behaviour
This paper assesses the extent to which education level affects how Canadians save and accumulate wealth for retirement. Data from administrative income-tax records and responses from the 1991 and 2006 censuses of Canada show that individuals with more schooling are more likely to contribute to a tax-preferred savings account and have higher saving rates, have higher home values, and are less likely to rent housing.
Chronic Low Income Among Immigrants in Canada and its Communities
This study examines the rate of chronic low income among adult immigrants (aged 25 or older) in Canada during the 2000s. Data is taken from the Longitudinal Immigration Database (IMDB) for the period from 1993 to 2012, with regional adjustments used for the analysis. Chronic low income is categorized as having a family income under a low-income cut-off for five consecutive years or more. The study found that for immigrants were in in low-income in any given year, half were in chronic low-income. Including spells of low income which become chronic in later years, this number rises to two-thirds. The highest chronic rates were found in immigrant seniors and immigrants who were unattached or lone parents. Chronic low income is a large component of income disparity and overall low income among immigrants.
Accessing the Canada Learning Bond: Meeting Identification and Income Eligibility Requirements
Introduced in 1998, the Canadian Education Savings Program (CESP) was designed as an incentive to encourage education savings for the post-secondary education of a child. The program is centred on Registered Education Savings Plans (RESPs), where savings accumulate tax-free until withdrawn, to pay for full- or part-time postsecondary studies such as a trade school, CEGEP, college, or university, or in an apprenticeship program. The CLB was introduced in 2004 specifically for children from low income families. CLB provides, without family contribution being required, eligible families with an initial RESP payment which may be followed by annual payments up until the child is aged 15 years old. The objective of this paper is to assess the extent to which not tax-filing and not having a SIN for a child could pose a challenge to accessing the CLB and the CESG. This study will address the knowledge gap by analyzing overall differences in SIN and tax-filing uptake by family income, levels of parental education, family type and Indigenous identity of the child. The findings will help understand access issues related to the CLB but also to other programs with similar administrative conditions. En francais: Accéder au Bon d’études canadien: l’atteinte des critères d’identification et d’éligibilité selon le revenu.
Debt and assets among senior Canadian families
Using data from the Survey of Financial Security (SFS), this article looks at changes in debt, assets and net worth among senior Canadian families over the period from 1999 to 2016. It also examines changes in the debt-to income ratio and the debt to-asset ratio of senior families with debt. This study finds that the proportion of senior families with debt increased from 27% to 42% between 1999 and 2016.
In sickness and in health: The association between health and household income
This study uses data from the Longitudinal and International Study of Adults (LISA) to analyze the association between health and household income. Using data on both self-reported general health and self-report mental health, as well as self-reported labour-market outcomes and linked tax records, the association between spouse-pair labour-market income and health is further decomposed into an employment effect reflecting the association between health and the probability of employment, an hours worked effect reflecting the association between health and the number of hours worked, and a wage effect reflecting
the association between health and hourly wages.
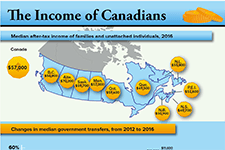
The income of Canadians
This infographic from Statistics Canada shows the median after-tax income of households, by province, as of 2016. It also shows changes in median government transfers, and number of people living on low incomes according to the after-tax low income measure.
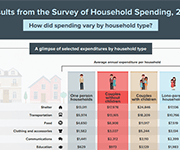
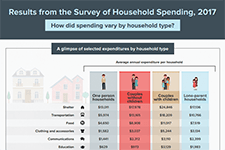
Results from the Survey of Household Spending, 2017 (Infographic)
This infographic from Statistics Canada summarizes the results of the Survey of Household Spending, 2017, including average annual expenditures by household type.
Earnings Inequality and the Gender Pay Gap in Canada
This study from Statistics Canada explores how increases in top earnings and the representation of women among top earners affect the overall gender earnings gap in Canada. Results show that even though the representation of women in top earnings groups increased from 1978 to 2015, their continued under-representation in these groups accounted for a substantial and growing share of the gender gap in total annual earnings.
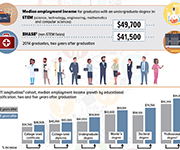
Infographic: Labour market outcomes for college and university graduates, 2010 to 2014
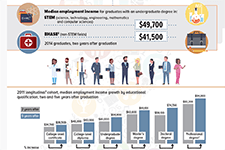
This infographic from Statistics Canada shows the labour market outcomes for college and university graduates between 2010 and 2014. It shows the median employment income achieved by graduates of different education levels, 2 years and 5 years post-graduation. Overall, it shows that people with higher levels of post-secondary education report higher employment income post-graduation.
Economic Well-being Across Generations of Young Canadians: Are Millenials Better or Worse Off?
This article in the Economic Insights series from Statistics Canada examines the economic well-being of millennials by comparing their household balance sheets to those of previous generations of young Canadians. Measured at the same point in their life course, millennials were relatively better off than young Gen-Xers in terms of net worth, but also had higher debt levels. Higher values for principal residences and mortgage debt mainly explain these patterns. Financial outcomes varied considerably among millennial households. Home ownership, living in Toronto or Vancouver, and having a higher education were three factors associated with higher net worth.
Financial Expectations and Household Debt
This Economic Insights article quantifies the degree to which families who expect their financial situation to get better in the next two years have, all else equal, more debt than comparable families. The study shows that even after a large set of socioeconomic characteristics is controlled for, families who expect their financial situation to improve in the near future have significantly more debt and generally higher debt-to-income ratios than other families.
The Economic Well-Being of Women in Canada
Economic well-being has both a present component and a future component. In the present, economic well-being is characterized by the ability of individuals and small groups, such as families or households, to consistently meet their basic needs, including food, clothing, housing, utilities, health care, transportation, education, and paid taxes. It is also characterized by the ability to make economic choices and feel a sense of security, satisfaction, and personal fulfillment with respect to finances and employment pursuits. Using Statistics Canada data from a variety of sources, including the Survey of Labour and Income Dynamics, the Canadian Income Survey, the Survey of Financial Security, and the 2016 Census of Population, this chapter of Women in Canada examines women’s economic well-being in comparison with men’s and, where relevant, explores how it has evolved over the past 40 years. In addition to gender, age and family type (i.e., couple families with or without children; lone mothers and fathers; and single women and men without children) are important determinants of economic well-being. Hence, many of the analyses distinguish between women and men in different age groups and/or types of families.
Indebtedness and Wealth Among Canadian Households
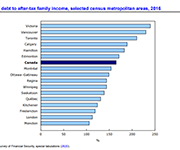
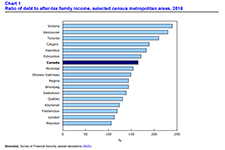
Understanding the health of the balance sheets of Canadian households is a complex issue that continues to generate considerable discussion. A new Statistics Canada study contributes to these discussions by highlighting the extent to which national measures of indebtedness and wealth mask significant variation across the country. The study is largely based on results from the 2016 Survey of Financial Security (SFS), which allow for a detailed profile by census metropolitan area (CMA) and by income groups.
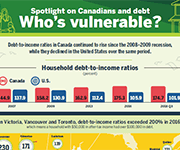
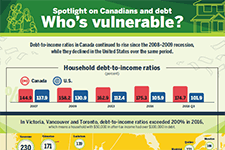
Spotlight on Canadians and Debt: Who’s Vulnerable
Debt-to-income ratios in Canada have continue to rise since the 2008-2009 recession, especially in urban centres where housing prices have increased over the last few years. This infographic from Statistics Canada shows where debt-to-income ratios are highest across Canada.

