Consumer Price Index: Annual review, 2022
The Consumer Price Index (CPI) rose 6.8% on an annual average basis in 2022, following gains of 3.4% in 2021 and of 0.7% in 2020. The increase in 2022 was a 40-year high, the largest increase since 1982 (+10.9%). Excluding energy, the annual average CPI rose 5.7% in 2022 compared with 2.4% in 2021. Price increases were broad-based in 2022, with prices up on an annual average basis in all eight major components. Canadians felt the impact of inflation, as prices for day-to-day basics such as transportation (+10.6%), food (+8.9%) and shelter (+6.9%) rose the most. Both goods and services prices rose at a faster pace compared with a year earlier. Prices for goods were up 8.7% on an annual average basis in 2022, led by higher prices for non-durable goods such as food purchased from stores (+9.8%) and gasoline (+28.5%). Prices for services increased 5.0% in 2022, led by homeowners' replacement cost (+9.5%) and other owned accommodation expenses (+10.0%). Year-over-year price growth accelerated each month in the first half of the year, reaching a high of 8.1% in June, and slowed in the second half of the year.
How Canadians bank
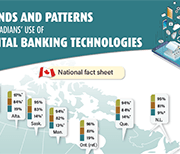
Banks in Canada are meeting the evolving preferences of their customers as powerful new technologies change the way people bank and how they pay for goods and services. Banking is transforming at a record pace, bringing innovation and new potential to empower Canadians’ lives in a digital world. This survey and other findings form the basis of How Canadians Banks, a biannual study by the Canadian Bankers Association and Abacus Data that examines the banking trends and attitudes of Canadians.
Survey on savings for persons with disabilities
Residents in Canada who have a severe and prolonged mental or physical disability are eligible for the Disability Tax Credit (DTC). This opens the door to other programs, one of which is the RDSP. Less than one-third of eligible residents in Canada (up to age 59) have a Registered Disability Savings Plan (RDSP)—about 31.5% in 2020. To understand why more eligible residents in Canada do not have an RDSP, Employment and Social Development Canada asked Statistics Canada to conduct the Survey on Savings for Persons with Disabilities. Its goal was to collect data from residents in Canada who were eligible for an RDSP but did not open one. These respondents included both persons with disabilities and family members or others who care for persons with disabilities, since the holder of the plan may not be the same person as the beneficiary in all cases. These data show that, in general, eligible residents in Canada lack information about the RDSP, with many not being aware it exists and a substantial portion reporting not having enough information or money to open one.
Asset resilience of Canadians, 2019
Canadians were more asset resilient just prior to the pandemic than they were at the turn of the millennium. That resilience continues to be tested as we enter the second year of the pandemic. For the purposes of this article, a household is asset resilient when it has liquid assets that are at least equal to the after-tax, low-income measure (LIM-AT) for three months. To be deemed asset resilient in 2019, a person living alone would require liquid assets of approximately $6,000. A household of four would require $12,000 or $3,000 per person to meet the minimum LIM-AT threshold for three months. Recent Statistics Canada data have shown that savings rose sharply during the pandemic, despite the economic upheaval, and that those in the lower income quintiles have seen their income rise as a result of government support programs, such as the Canada Emergency Response Benefit (CERB). Although the data in this release predate the pandemic, they provide an important benchmark to monitor the economic well-being of Canadian households during a time of unprecedented change.
A statistical portrait of Canada’s diverse LGBTQ2+ communities
Statistics Canada presents a demographic and social profile of Canada's diverse LGBTQ2+ communities based on published analyses. Much of the data in this release focus on LGB Canadians (lesbian, gay, bisexual), since Statistics Canada has been collecting detailed information on these communities since 2003.
Low-income persistence in Canada and the provinces
Each year, some Canadians fall into low income, while others rise out of it. For example, over one-quarter (28.1%) of Canadians who were in low income in 2017 had exited it by 2018. This study examines the low income exit rate in Canada—an indicator that can be used to track the amount of time it takes for people to rise out of low income. Although a potential surge in low income in 2020 as a result of the COVID-19 pandemic was avoided by temporary government support programs, the rising long-term unemployment rate in 2021 suggests a possible increase in poverty and low-income persistence in the future.
Household economic well-being during the COVID-19 pandemic, experimental estimates, fourth quarter 2020
A highlight of some of the findings reported in this briefing:
A labour market snapshot of South Asian, Chinese and Filipino Canadians during the pandemic
The COVID-19 pandemic has highlighted the varying labour market experiences and outcomes of diverse groups of Canadians. To mark Asian Heritage Month, Statistics Canada is providing a profile of the employment characteristics of the three largest Asian populations in Canada: South Asian, Chinese and Filipino Canadians. Results from the Labour Force Survey (LFS) show that South Asian men are much more likely to be employed than South Asian women, that Chinese Canadians have higher average hourly wages than other visible minority groups, and that Filipino women have among the highest employment rates of all groups, with many working on the front line in the health care sector during the pandemic. Unless otherwise stated, all data in this article reflect the population aged 15 to 69 during the three months ending in April 2021, and are not seasonally adjusted.
A snapshot: Status First Nations people in Canada
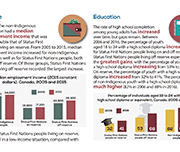
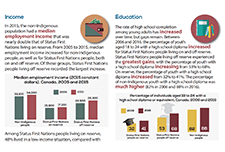
This is a custom report produced in collaboration between the Assembly of First Nations and Statistics Canada. It includes a variety of social and economic statistics for Status First Nations people living on and off reserve and includes comparisons with the non-Indigenous population.
Proposals for a Northern Market Basket Measure and its disposable income
As stated in the Poverty Reduction Act, the Market Basket Measure (MBM) is now Canada’s Official Poverty Line. The Northern Market Basket Measure (MBM-N) is an adaptation of the MBM that reflects life and conditions in two of the territories – Yukon and Northwest TerritoriesNote. As with the MBM, the MBM-N is comprised of five major components: food, clothing, transportation, shelter and other necessities. The MBM-N is intended to capture the spirit of the existing MBM (i.e., represent a modest, basic standard of living) while accounting for adjustments to the contents of the MBM to reflect life in the North. This discussion paper describes a proposed methodology for the five components found in the MBM-N, as well as its disposable income. This discussion paper also provides an opportunity for feedback and comments on the proposed methodology of the MBM-N.
Study: A labour market snapshot of Black Canadians during the pandemic
In the context of the COVID-19 pandemic, many Canadians, including Black Canadians, have experienced significant economic hardship, while others put themselves at risk through their work in essential industries such as health care and social assistance. Statistics Canada looked at how the 1 million Black Canadians aged 15 to 69 are faring in the labour market during one of the most disruptive times in our economic history. Analysis of the recent labour market situation of population groups designated as visible minorities is now possible as a result of a new question added to the Labour Force Survey (LFS) in July 2020. Unless otherwise stated, all data in this release are unadjusted for seasonality and are based on three-month averages ending in January 2021.
Aboriginal Peoples Survey: Data tables, 2017
New data tables on the labour activities of Indigenous Peoples are now available. Data are from the 2017 Aboriginal Peoples Survey and include information on labour force status, job satisfaction, skills training, skills that limit job opportunities, job permanency, part-time or full-time job status, mismatch of skills for current job, disability status and disability severity class, by Indigenous identity, age group and sex. Data are available for Canada, the provinces (Atlantic provinces combined) and the territories.
Longitudinal Immigration Database: Asylum claimant and immigrant economic region tables, 2018
Tables on the income and mobility of immigrants by economic region, and a table on asylum claimant economic outcomes, are now available. These tables use data from the Longitudinal Immigration Database.
NWT Market Basket Measure
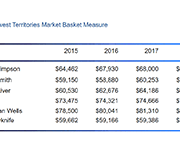
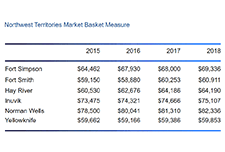
The Market Basket Measure (MBM) is a national measure of low income based on the cost of a fixed basket of goods that represents a modest, basic standard of living. It includes the cost of food, clothing and footwear, transportation, shelter, and other expenses for a reference family of two adults (aged 25 to 49) and two children (aged 9 and 13).
The Northwest Territories Market Basket Measure (NWT-MBM) adjusts the clothing portion of the national basket to better represent life in the North. This has been used to calculate the NWT-MBM for regional centres across the NWT.
Low income measure (LIM) thresholds by income source and household size
Low income measure (LIM) thresholds by household size for market income, total income and after-tax income, in current and constant dollars, annual.
Labour Force Survey, February 2021
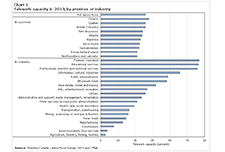
February Labour Force Survey (LFS) data reflect labour market conditions during the week of February 14 to 20. In early February, public health restrictions put in place in late December were eased in many provinces. This allowed for the re-opening of many non-essential businesses, cultural and recreational facilities, and some in-person dining. However, capacity limits and other public health requirements, which varied across jurisdictions, remained in place. Restrictions were eased to varying degrees in Quebec, Alberta, New Brunswick, and Nova Scotia on February 8, although a curfew remained in effect in Quebec. In Ontario, previous requirements were lifted for many regions on February 10 and 15, while the Toronto, Peel, York and North Bay Parry Sound health regions remained under stay-at-home orders through the reference week. Various measures were eased in Manitoba on February 12. In contrast, Newfoundland and Labrador re-introduced a lockdown on February 12, requiring the widespread closure of non-essential businesses and services.
Diversity of charity and non-profit boards of directors: Overview of the Canadian non-profit sector
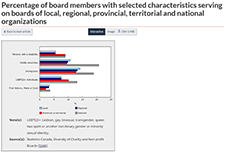
Charities and non-profit organizations play a vital role in supporting and enriching the lives of Canadians. A crowdsourcing survey of individuals involved in the governance of charities and non-profit organizations was conducted from December 4, 2020, to January 18, 2021. The objectives of the survey were to collect timely information on the activities of these organizations and the individuals they serve and to learn more about the diversity of those who serve on their boards of directors. A total of 8,835 individuals completed the survey, 6,170 of whom were board members.
Labour Force Survey, January 2021
After the December Labour Force Survey (LFS) reference week—December 6 to 12—a number of provinces extended public health measures in response to increasing COVID-19 cases. January LFS data reflect the impact of these new restrictions and provide a portrait of labour market conditions as of the week of January 10 to 16. In Ontario, restrictions already in place for many regions of southern Ontario—including the closure of non-essential retail businesses—were extended to the rest of the province effective December 26. In Quebec, non-essential retail businesses were closed effective December 25 and a curfew implemented on January 14 further affected the operating hours of some businesses. As of the January reference week, existing public health measures continued in Alberta and Manitoba, including the closure of in-person dining services, recreation facilities and personal care services, as well as restrictions on retail businesses. Restrictions were eased between the December and January reference weeks in two provinces. In Prince Edward Island, closures of in-person dining and recreational and cultural facilities were lifted on December 18. In Halifax, Nova Scotia, and the surrounding area, restrictions on in-person dining were eased on January 4.
Income and mobility of immigrants, 2018
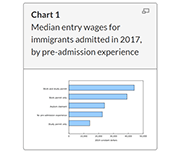
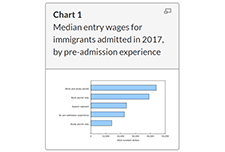
The COVID-19 pandemic has affected many aspects of Canadian immigration, including reduced permanent resident admissions and lower labour market outcomes. This article presents the latest economic and mobility outcomes of immigrants admitted to Canada using data from the 2019 Longitudinal Immigration Database, and provides baseline estimates prior to the pandemic for future analyses. In recent years, the profile of immigrants admitted to Canada has changed. The median entry wage for immigrants admitted to Canada in 2017 was the highest to date, reaching $30,100 in 2018. This value surpassed the previous high of $26,500 for 2017 outcomes of immigrants admitted in 2016. These new data also highlight a decreasing gap between the immigrant median entry wage and the Canadian median wage ($37,400). Factors such as pre-admission experience, knowledge of official languages, and category of admission, among other socioeconomic characteristics, could contribute to the rise in median entry wage compared with previous admission years.
Statistic Canada’s Longitudinal Immigration Database: Birth area and income table, 2018
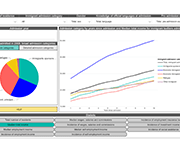
Statistics Canada's Longitudinal Immigration Database (IMDB) Interactive Application has been updated to include data on citizenship intake rates and income by birth area, sex, pre-admission experience and admission category. This table includes income measures up to 2018 for immigrants admitted to Canada since 2008.
Report on the Charities Program 2018 to 2020
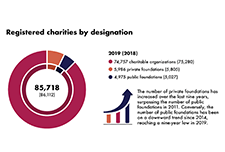
The charitable sector is a major social and economic force, offering vital services to Canadians and people around the world. The Canada Revenue Agency's Charities Directorate employs an education-first approach and client-centric philosophy. It aims to promote compliance with the charity-related income tax legislation and regulations in order to support charitable giving and development of the sector, while protecting charities and the public from abuse. This report provides an update on the Directorate’s activities over the past two years, including the initial impact of the COVID-19 pandemic.
Study: The changing nature of work in Canada amid recent advances in automation technology
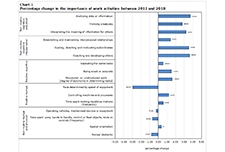
While automation has changed the nature of work in Canada over the past few decades, this change was very gradual, and did not accelerate with the very recent developments in artificial intelligence. The results of this study reveal that the share of Canadians working in managerial, professional and technical occupations increased from 23.8% in 1987 to 31.2% in 2018, while the share employed in service occupations increased more moderately from 19.2% to 21.8% over the same timeframe. Jobs in both of these occupational groups are generally difficult to automate. Meanwhile, the share of workers employed in production, craft, repair and operative occupations (more automatable tasks) went from 29.7% in 1987 to 22.2% in 2018, while the share employed in sales, clerical and administrative support occupations also fell over the period (from 27.3% in 1987 to 24.9% in 2018). These jobs are generally more amenable to automation.
Statistics on Indigenous peoples
This data hub includes data on the following subjects:
Consumer Price Index Personal Inflation Calculator
This interactive tool created by Statistics Canada allows you to explore your personal rate of inflation, based on the goods and services you consume. The Consumer Price Index (CPI) is the official measure of inflation in Canada. It is representative of the change in prices experienced by the average Canadian household. However, your personal experience of inflation may not perfectly match the Canadian average due to differences in your spending habits. The Personal Inflation Calculator accounts for those differences and provides a measure of inflation unique to you.
Labour Force Survey, December 2020
December Labour Force Survey (LFS) results reflect labour market conditions as of the week of December 6 to 12. As of the reference week, public health measures introduced earlier in the fall remained in place in Manitoba and much of Quebec. These included the closure of many recreation and cultural facilities and in-person dining services, as well as various degrees of restrictions on retail businesses.
State of the Child Report 2020: Protecting Child Rights in Times of Pandemic
The 2020 State of the Child Report includes six recommendations and gives a snapshot of some of the challenges New Brunswick children and youth will have to overcome as the province moves forward and juggles the new realities of public health measures to prevent the spread of COVID-19 while respecting child rights.
State of the Child Report 2019
This report's release was part of Child Rights Education Week and also in celebration of the 30th anniversary of the United Nations Convention on the Rights of the Child (UNCRC). 2019 was declared the International Year of Indigenous Languages by the United Nations. The report contains an overview of some of the serious challenges facing New Brunswick children and youth, including more than 200 statistics presented in the report’s Child Rights Indicators Framework. A special emphasis was placed on education rights. Some of the concerning findings revealed in the report include:
Canadian Economic Dashboard and COVID-19
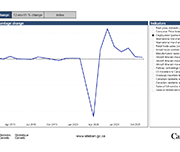
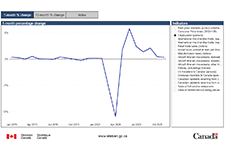
This dashboard presents selected data that are relevant for monitoring the impacts of COVID-19 on economic activity in Canada. It includes data on a range of monthly indicators - real GDP, consumer prices, the unemployment rate, merchandise exports and imports, retail sales, hours worked and manufacturing sales -- as well as monthly data on aircraft movements, railway carloadings, and travel between Canada and other countries.
Inter-generational comparisons of household economic well-being, 1999 to 2019
This study of data from the Distributions of Household Economic Accounts compares households' economic well-being from a macro-economic accounts perspective, as measured by net saving and net worth for each generation when the major income earner for a household in one generation reached the same point in the life cycle as the major income earner for a household in another generation. The study finds that while younger generations have higher disposable income and higher consumption expenditure than older generations when they reached the same age, their net saving is relatively similar. As well, younger generations' economic well-being may be more at risk due to the COVID-19 pandemic since they depend more on employment as a primary source of income, they have higher debt relative to income, and they have less equity in financial and real estate assets from which to draw upon when needed.
Gender Results Framework: Data table on core housing need
Statistics Canada's Centre for Gender, Diversity and Inclusion Statistics has released an enhanced data table on the topic of core housing need. These statistics will be used by the Gender Results Framework, a whole-of-government tool designed to track gender equality in Canada. Using data from the 2006 Census of Population, the 2016 Census of Population and the 2011 National Household Survey, the table shows the proportion of the population in core housing need by selected economic family characteristics. This table includes a breakdown by province and territory, age group as well as other demographic characteristics such as population groups designated as visible minorities and Indigenous identity.
A profile of Canadians with a mobility disability and groups designated as visible minorities with a disability
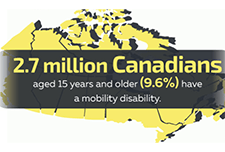
Results from the 2017 Canadian Survey of Disability (CSD) have shown that over half of Canadians with a mobility disability need at least one workplace accommodation. Among population groups designated as visible minorities who have a disability, one-quarter considered themselves to be disadvantaged in employment because of their condition. In recognition of the International Day of Persons with Disabilities, Statistics Canada released three new data products based on findings from the 2017 CSD. One infographic focuses on disabilities related to mobility and another takes a look at visible minorities with disabilities. In addition, two data tables, on industry and occupation of those with and without disabilities, are now available.
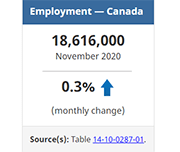
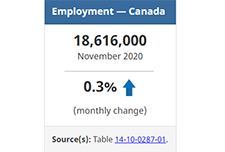
Labour Force Survey, November 2020
November Labour Force Survey (LFS) results reflect labour market conditions as of the week of November 8 to 14. In September and October, many provinces began introducing targeted public health measures in response to rising COVID-19 numbers. In early November, restrictions related to indoor dining and fitness facilities were eased in Ontario, while in Manitoba new measures affecting restaurants, recreational facilities and retail businesses were introduced. Much of Quebec remained at the "red" alert level in November, leading to the ongoing closure of indoor dining and many recreational and cultural facilities.
The long-term labour market integration of refugee claimants who became permanent residents in Canada
Although refugee claimants seek asylum in Canada for humanitarian reasons, their labour market outcomes play a crucial role in their successful integration, which is why it is important to monitor the degree of labour market success achieved by refugee claimants. This study compares the long-term labour market outcomes of refugee claimants who eventually became permanent residents in Canada (RC-PRs) with those of government-assisted refugees (GARs) and privately sponsored refugees (PSRs), as well as with refugee claimants who did not become permanent residents in Canada (RC-NPRs).
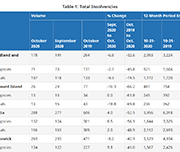
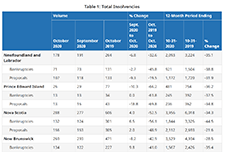
Office of the Superintendent of Bankruptcy Canada: Statistics and Research
The Office of the Superintendent of Bankruptcy Canada releases statistics on insolvency (bankruptcies and proposals) numbers in Canada. The latest statistics released on November 4, 2020 show that the number of insolvencies in Canada increased in the third quarter of 2020 by 7.9% compared to the second quarter.
Labour Force Survey, October 2020
October Labour Force Survey (LFS) results reflect labour market conditions as of the week of October 11 to 17. By then, several provinces had tightened public health measures in response to a spike in COVID-19 cases. Unlike the widespread economic shutdown implemented in March and April, these measures were targeted at businesses where the risk of COVID transmission is thought to be greater, including indoor restaurants and bars and recreational facilities. Employment increased by 84,000 (+0.5%) in October, after growing by an average of 2.7% per month since May. The unemployment rate was 8.9%, little changed from September. Employment increases in several industries were partially offset by a decrease of 48,000 in the accommodation and food services industry, largely in Quebec.
Labour Force Survey, September 2020
The September Labour Force Survey (LFS) results reflect labour market conditions as of the week of September 13 to 19. At the beginning of September, as Canadian families adapted to new back-to-school routines, public health restrictions had been substantially eased across the country and many businesses and workplaces had re-opened. Throughout the month, some restrictions were re-imposed in response to increases in the number of COVID-19 cases. In British Columbia, new rules and guidelines related to bars and restaurants were implemented on September 8. In Ontario, limits on social gatherings were tightened for the hot spots of Toronto, Peel and Ottawa on September 17 and for the rest of the province on September 19.
Data literacy training
Statistics Canada presents a learning catalogue to share knowledge on data literacy. Data literacy is the ability to derive meaningful information from data. It focuses on the competencies involved in working with data including the knowledge and skills to read, analyze, interpret, visualize and communicate data as well as understand the use of data in decision-making. Their aim is to provide learners with information on the basic concepts and skills with regard to a range of data literacy topics. The training is aimed at those who are new to data or those who have some experience with data but may need a refresher or want to expand their knowledge.
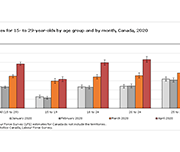
Impact of the COVID-19 pandemic on the NEET (not in employment, education or training) indicator, March and April 2020
A fact sheet released by Statistics Canada shows that, in March and April 2020, the proportion of young Canadians who were not in employment, education or training (NEET) increased to unprecedented levels. The COVID-19 pandemic—and the public health interventions that were put in place to limit its spread—have affected young people in a number of ways, including high unemployment rates, school closures and education moving online.
Growing up in a lower-income family can have lasting effects
The infographic "Intergenerational income mobility: The lasting effects of growing up in a lower-income family" based on the article "Exploration of the role of education in intergenerational income mobility in Canada: Evidence from the Longitudinal and International Study of Adults," published in the Canadian Public Policy journal presents the effects of growing up in a lower-income family based on a longitudinal study of a cohort of Canadians born between 1963 and 1979.
Labour Force Survey, August 2020
The August Labour Force Survey (LFS) results reflect labour market conditions as of the week of August 9 to 15, five months following the onset of the COVID-19 economic shutdown. By mid-August, public health restrictions had substantially eased across the country and more businesses and workplaces had re-opened.
Low Income Measure: Comparison of Two Data Sources, T1 Family File and 2016 Census of Population
This study looks at the differences in after-tax low income measure (LIM) statistics from two data sources which both use administrative tax data as their principal inputs: the 2016 Census of Population and the T1 Family file (T1FF). It presents a summary of the two data sources and compares after-tax LIM statistics by focussing on unit of analysis, LIM thresholds and the percentage of population below the LIM. The study also explores what factors users may want to consider when choosing one data source over the other.
Transitions into and out of employment by immigrants during the COVID-19 lockdown and recovery
During the widespread lockdown of economic activities in March and April 2020, the Canadian labour market lost 3 million jobs. From May to July, as many businesses gradually resumed their operations, 1.7 million jobs were recovered. While studies in the United States and Europe suggest that immigrants are often more severely affected by economic downturns than the native born (Borjas and Cassidy 2020; Botric 2018), little is known about whether immigrants and the Canadian born fared differently in the employment disruption induced by the COVID-19 pandemic and, if so, how such differences are related to their socio-demographic and job characteristics. This paper fills this gap by comparing immigrants and the Canadian-born population in their transitions out of employment in the months of heavy contraction and into employment during the months of partial recovery. The analysis is based on individual-level monthly panel data from the Labour Force Survey and focuses on the population aged 20 to 64. Immigrants are grouped into recent immigrants who landed in Canada within 10 years or less, and long-term immigrants who landed in Canada more than 10 years earlier.
Changes in the socioeconomic situation of Canada’s Black population
This study provides disaggregated statistics on the socioeconomic outcomes of the Black population by generation status (and immigrant status), sex and country of origin, and is intended to illustrate and contribute to the relevance of disaggregation in understanding these populations and the diversity of their situation. This study sheds light on some of the issues faced by the Black population and shows differences that exist compared with the rest of the working-age population, by sex, generation and place of origin, from 2001 to 2016.
Financial well-being in America
This report provides a view into the state of financial well-being in America. It presents results from the National Financial Well-Being Survey, conducted in late 2016. The findings include the distribution of financial well-being scores for the overall adult population and for selected subgroups, which show that there is wide variation in how people feel about their financial well-being. The report provides insight into which subgroups are faring relatively well and which ones are facing greater financial challenges, and identifies opportunities to improve the financial well-being of significant portions of the U.S. adult population through practice and research.
New Risks and Emerging Technologies: 2019 BBB Scam Tracker Risk Report
The Better Business Bureau Institute for Marketplace Trust (BBB Institute) is the 501(c)(3) educational foundation of the Better Business Bureau (BBB). BBB Institute works with local BBBs across North America. This report uses data submitted by consumers to BBB Scam Tracker to shed light on how scams are being perpetrated, who is being targeted, which scams have the greatest impact, and much more. The BBB Risk Index helps consumers better understand which scams pose the highest risk by looking at three factors—exposure, susceptibility, and monetary loss. The 2019 BBB Scam Tracker Risk Report is a critical part of BBB’s ongoing work to contribute new, useful data and analysis to further the efforts of all who are engaged in combating marketplace fraud. Update February 24, 2022: BBB Scam Tracker- Risk Report 2020
Canadian Health Survey on Children and Youth, 2019
The current pandemic has reinforced the need for additional information on the health of Canadian children and youth, particularly for those younger than age 12. Results from the new Canadian Health Survey on Children and Youth (CHSCY) indicate that 4% of children and youth aged 1 to 17, as reported by their parents, had fair or poor mental health in 2019, one year prior to the pandemic. The survey also found that poor mental health among children and youth was associated with adverse health and social outcomes, such as lower grades and difficulty making friends. Recently released crowdsourced data suggest that the perceived mental health of Canadian youth has declined during the pandemic, with over half (57%) of participants aged 15 to 17 reporting that their mental health was somewhat worse or much worse than it was prior to the implementation of physical distancing measures.
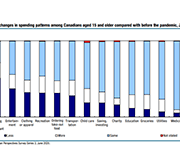
Expected changes in spending habits during the recovery period
Around mid-June, physical distancing measures began easing across the country, giving Canadians more opportunities to spend money. However, COVID-19 is still with us, shopping habits have changed and there are 1.8 million fewer employed Canadians now than there were prior to the pandemic. How our economy evolves going forward will largely depend upon the spending choices Canadians make over the coming weeks and months. This study presents results from a recent web panel survey conducted in June, looks at how spending habits may change.
Labour Force Survey in brief: Interactive app
Part of the Canadian Labour Market Observatory, this interactive data visualization application showcases publicly available labour market information. The fully interactive applications allow Canadians to quickly and easily personalize the information in a way that is relevant to them and their interests.
Infographic: COVID-19 and the labour market in June 2020
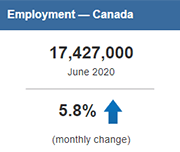
This infographic displays information on the Canadian labour market in June 2020 as a result of COVID-19.
Labour Force Survey, June 2020
Labour Force Survey (LFS) results for June reflect labour market conditions as of the week of June 14 to June 20. A series of survey enhancements continued in June, including additional questions on working from home, difficulty meeting financial needs, and receipt of federal COVID-19 assistance payments. New questions were added to measure the extent to which COVID-19-related health risks are being mitigated through workplace adaptations and protective measures.
Prosperity Now Scorecard
The Prosperity Now Scorecard is a comprehensive resource featuring data on family financial health and policy recommendations to help put all U.S. households on a path to prosperity. The Scorecard equips advocates, policymakers and practitioners with national, state, and local data to jump-start a conversation about solutions and policies that put households on stronger financial footing across five issue areas: Financial Assets & Income, Businesses & Jobs, Homeownership & Housing, Health Care and Education.
Locked down, not locked out: An eviction prevention plan for Ontario
Social Assistance Summaries
The Social Assistance Summaries series tracks the number of recipients of social assistance (welfare payments) in each province and territory. It was established by the Caledon Institute of Social Policy to maintain data previously published by the federal government as the Social Assistance Statistical Report. The data is provided by provincial and territorial government officials.
Volunteering in Canada: Challenges and opportunities during the COVID-19 pandemic
In 2018, over 12.7 million Canadians engaged in formal volunteering, with a total of 1.6 billion hours of their time given to charities, non-profits and community organizations—equivalent to almost 858,000 full-time year-round jobs. Today, Canadians are courageously volunteering in the midst of one of the largest health, economic and social challenges of our lifetime. The study, based upon the 2018 General Social Survey on Giving, Volunteering and Participating, measures the contributions of those who have given their time. While these data are from prior to the COVID-19 pandemic, they provide insight into challenges and opportunities facing volunteerism in the current situation.
Inequality in the feasibility of working from home during and after COVID-19
The economic lockdown to stop the spread of COVID-19 has led to steep declines in employment and hours worked for many Canadians. For workers in essential services, in jobs that can be done with proper physical distancing measures or in jobs that can be done from home, the likelihood of experiencing a work interruption during the pandemic is lower than for other workers. To shed light on these issues, this article assesses how the feasibility of working from home varies across Canadian families. It also considers the implications of these differences for family earnings inequality.
Infographic: The impact of COVID-19 on the Canadian labour market
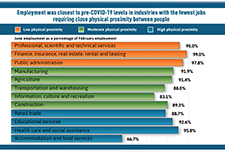
This infographic presents information on the impact of COVID-19 on the Canadian labour market, based from the Labour Force Survey conducted each month. Over three million Canadians were affected by job loss or reduced hours.
Infographic: How are Canadians coping with the COVID-19 situation?
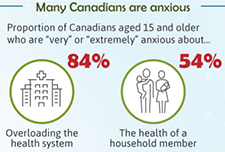
An infographic on the findings from a web panel online survey conducted by Statistics Canada between March 29 and April 3 on how Canadians are responding to the COVID-19 situation. A summary of how many Canadians are feeling anxious, what they are doing during the crisis, and the main precautions that they are taking are presented.
Canadian Perspectives Survey Series 1: Impacts of COVID-19 on job security and personal finances, 2020
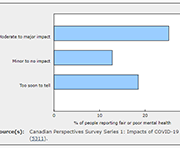
Findings from a web panel survey developed by Statistics Canada on how Canadians are coping with COVID-19. More than 4,600 people in the 10 provinces responded to this survey from March 29 to April 3. In addition to content on the concerns of Canadians and the precautions they took to reduce the risk of exposure to COVID-19, the survey includes questions on work location, perceptions of job security, and the impact of COVID-19 on financial security.
Community Volunteer Income Tax Program (CVITP) provincial snapshots
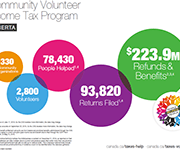
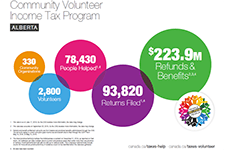
This infographics from the Community Volunteer Income Tax Program (CVITP) show information about the program by province for the tax filing year 2019, including number of returns filed and amount of refunds and benefits accessed. The information is presented in English and French. Les informations sont présentées en anglais et en français.
Defining Disposable income in the Market Basket Measure
This paper discusses the concept of disposable income used in the MBM. Disposable income is a measure of the means available to a Canadian family to meet its basic needs and achieve a modest standard of living. The disposable income of families surveyed in the Canadian Income Survey (CIS) is compared to the cost of the MBM basket for the size of the family and the region, and families with disposable incomes below that cost are deemed to be living in poverty.
The Dynamics of Disability: Progressive, Recurrent or Fluctuating Limitations
Different from common perception, many disabilities do not follow a stable pattern. Persons with disabilities may experience periods of good health in between periods of their limitations and/or experience changes in the severity of their limitations over time. These types of disabilities may be characterized as dynamic because the very nature of the disability is one of change with different possible trajectories over time. As a consequence, the collective experiences of those with disability dynamics are likely to be different than those with so-called “continuous” disabilities. In this paper, four groups of persons with different disability dynamics (or lack of dynamics) are profiled based on data from the 2017 Canadian Survey on Disability. Each group has their own unique demographic, employment, and workplace accommodation profile based on the length of time between periods of their limitations, as well as changes in their limitations over time.
Results from the 2016 Census: Examining the effect of public pension benefits on the low income of senior immigrants
This is a study released by Insights on Canadian Society based on 2016 Census data. Census information on immigration and income is used to better understand the factors associated with low income among senior immigrants. This study examines the factors associated with the low-income rate of senior immigrants, with a focus on access to Old Age Security (OAS) and Guaranteed Income Supplement (GIS) benefits.
Welfare in Canada, 2018
These reports look at the total incomes available to those relying on social assistance (often called “welfare”), taking into account tax credits and other benefits along with social assistance itself. The reports look at four different household types for each province and territory. Established by the Caledon Institute of Social Policy, Welfare in Canada is a continuation of the Welfare Incomes series originally published by the National Council of Welfare, based on the same approach.
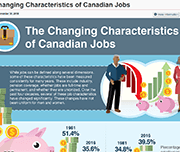
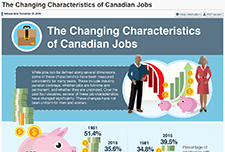
Infographic: The Changing Characteristics of Canadian Jobs
This infographic released by Statistics Canada shows some of the ways the Canadian workforce has changed from 1981 to 2018. Some of these changes include industry, pension coverage, whether jobs are full-time and permanent, and whether they are unionized. These changes have also not been uniform for men and women.
Infographic: New Data on Disability in Canada, 2017
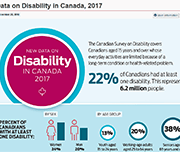
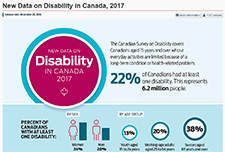
This infographic released from Statistics Canada compiles some of the data collected from the 2017 Canadian Survey on Disability. 22% of Canadians had at least one disability, representing 6.2 million people.
Low income among persons with a disability in Canada
Persons with a disability face a higher risk of low income compared to the overall population. This report uses data from the 2014 Longitudinal and International Study of Adults (LISA) to study the relationship between low income and characteristics of people aged 25 to 64 with a disability, including disability type, severity class, age of onset of disability, family composition, and other risk factors associated with low income. It also examines the composition of the low-income population in relation to disability, and provides information on the relationship between employment and low income for this population.
Does education pay? A comparison of earnings by level of education in Canada and its provinces and territories
This report examines the relationship between the earnings of Canadians in the labour market and their post-secondary education credentials. Findings are based upon information gathered from the 2016 Census on adults between the ages of 25 to 64 with different levels of education and working in different parts of the country.
Debt and mental health: A statistical update
Financial problems can be a significant source of distress, putting pressure on people's mental health, particularly if they are treated insensitively by creditors. Some people in financial difficulty cut back on essentials, such as heating and eating, or social activities that support their well being, to try and balance their budget. In many cases this has a negative impact on people's mental health. This policy note from draws on nationally representative data to update key statistics on the relationship between debt and mental health problems, and sets out implications for policymakers, service providers and essential services firms.
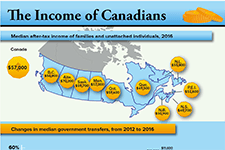
The income of Canadians
This infographic from Statistics Canada shows the median after-tax income of households, by province, as of 2016. It also shows changes in median government transfers, and number of people living on low incomes according to the after-tax low income measure.
Economic Well-being Across Generations of Young Canadians: Are Millenials Better or Worse Off?
This article in the Economic Insights series from Statistics Canada examines the economic well-being of millennials by comparing their household balance sheets to those of previous generations of young Canadians. Measured at the same point in their life course, millennials were relatively better off than young Gen-Xers in terms of net worth, but also had higher debt levels. Higher values for principal residences and mortgage debt mainly explain these patterns. Financial outcomes varied considerably among millennial households. Home ownership, living in Toronto or Vancouver, and having a higher education were three factors associated with higher net worth.
NPW 2018 Employee Research Survey
Working Canadians seem to be making some minor progress towards improving their financial health. But, while 66% report being in a better financial position than a year ago, their debt levels remain high, they chronically undersave for retirement, and put themselves at severe risk in the event of economic changes. According to the Canadian Payroll Association’s tenth annual survey, 44% of working Canadians report it would be difficult to meet their financial obligations if their pay cheque was delayed by even a single week (down from the three-year average of 48%). View full suite of news release and infographics from this survey, by province.
Resources
Talking to our neighbours: America’s household balance sheets
Household Financial Stability and Income Volatility, Ray Boshara, Federal Reserve Bank of St. Louis
Income volatility: What banking data can tell us, if we ask, Fiona Greig, JP Morgan Chase Institute
Up Close and Personal: Findings from the U.S. Financial Diaries, Rob Levy, CFSI
The good, the bad, and the ugly: Canada’s household balance sheets
Canada’s household balance sheets, Andrew Heisz, Statistics Canada
Income volatility and its effects in Canada: What do we know?
Pervasive and Profound: The impact of income volatility on Canadians, Derek Burleton, TD Economics
Income and Expense Volatility Survey Results, Patrick Ens, Capital One
Neighbourhood Financial Health Index: Making the Invisible Visible, Katherine Scott, Canadian Council on Social Development
What gets inspected, gets respected: Do we have the data we need to tackle household financial instability?
Do we have the data we need to tackle household financial instability?, Catherine Van Rompaey, Statistics Canada
Emerging solutions
Income volatility: Strategies for helping families reduce or manage it, David S. Mitchell, Aspen Intitute
Building consumer financial health: The role of financial institutions and FinTech, Rob Levy, CFSI
Redesigning Social Policy for the 21st Century, Sunil Johal, Mowat Centre
Strengthening retirement security for low- and moderate-income workers, Johnathan Weisstub, Common Wealth
Canada’s household balance sheets
In this video presentation Andrew Heisz from Statistics Canada explains the changing household assets, debt, and income levels of Canadians of different age generations. This presentation was given at the Prosper Canada Policy Research Symposium on March 9, 2018. Read the slide deck that accompanies this presentation. View the full video playlist of all presentations from this symposium.


