


Having wealth, or a family’s assets minus their debts, is important not just for the rich— everyone needs wealth to thrive. Yet building the amount of wealth needed to thrive is a major challenge. Nearly 13 million U.S. households have negative net worth. Millions more are low wealth; they do not have the assets or liquidity needed to maintain financial stability and invest in themselves in the present, nor are they on track to accumulate the amount of wealth they will need to have financial security in retirement. This report examines what it will take to create truly shared prosperity in the United States. It is focused on solutions that would grow the wealth of households in the bottom half of the wealth distribution, and it explores reparative approaches to building the wealth of Black, Indigenous, and other people of color (BIPOC).
Together, these groups represent at least half of all U.S. households.

Canadians were more asset resilient just prior to the pandemic than they were at the turn of the millennium. That resilience continues to be tested as we enter the second year of the pandemic. For the purposes of this article, a household is asset resilient when it has liquid assets that are at least equal to the after-tax, low-income measure (LIM-AT) for three months. To be deemed asset resilient in 2019, a person living alone would require liquid assets of approximately $6,000. A household of four would require $12,000 or $3,000 per person to meet the minimum LIM-AT threshold for three months. Recent Statistics Canada data have shown that savings rose sharply during the pandemic, despite the economic upheaval, and that those in the lower income quintiles have seen their income rise as a result of government support programs, such as the Canada Emergency Response Benefit (CERB). Although the data in this release predate the pandemic, they provide an important benchmark to monitor the economic well-being of Canadian households during a time of unprecedented change.
A highlight of some of the findings reported in this briefing:
The evolution of the wealth, assets and debts of various groups of Canadians since the late 1990s has been documented in several studies. Yet little is known about the evolution of the wealth holdings of unattached men and women aged 50 and older, who make up a large part of the population. This study assesses how the wealth holdings of unattached men and women aged 50 and older evolved from 1999 to 2016 using data from the Survey of Financial Security of 1999, 2005, 2012 and 2016, and fills this information gap.
This report summarizes the results of a follow-up survey with nineteen low- and modest-middle income Winnipeggers, undertaken in June through September 2020. These respondents were drawn from the 29 Canadian Financial Diaries (CFD) participants who completed a year-long diary in 2019. The results of the survey illustrate that low- and moderate-income earners are feeling stressed with increased expenses and uncertainty about future economic stability.


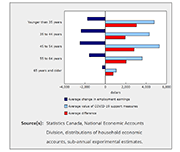
Over the first three quarters of 2020, disposable income for the lowest-income households increased 36.8%, more than for any other households. At the same time, the youngest households recorded the largest gain in their net worth (+9.8%). These changes were driven by unprecedented increases in transfers to households, as the value of government COVID-19 support measures exceeded losses in wages and salaries and self-employment income. As the pandemic unfolded in Canada, households experienced extraordinary changes in their economic well-being. While quarterly releases of gross domestic product and the national balance sheet provide an aggregate view of these impacts, new experimental sub-annual distributions of household economic accounts (DHEA), released today, provide insight into how the pandemic and the associated government support measures have affected the economic well-being of different groups of households in Canada.

This is the second brief in a new series from The Financial Clinic. Change Matters leverages the data gathered through our revolutionary financial coaching platform, Change Machine, alongside the voices, wisdom, and lived experiences of Change Machine customers. We hope that our action oriented analysis will lead to positive social change. We believe we have a responsibility to ask the right questions, to use our data for good, and to inspire products, practice, and policy innovations that centralize the needs of the working-poor in building economic mobility.


Building on the Asset Funders Network’s the Health and Wealth Connection: Investment Opportunities Across the Life Course brief, this paper details: On September 29th, AFN hosted a webinar to release the paper with featured speakers: Dr. Annie Harper, Ph.D., Program for Recovery and Community Health, Yale School of Medicine
Joelle-Jude Fontaine, Sr. Program Officer, Human Services, The Kresge Foundation
Dedrick Asante-Muhammad, Chief of Race, Wealth, and Community, National Community Reinvestment Coalition

The COVID-19 pandemic has already had an unprecedented impact on the financial lives of households across the United States. During June and July 2020, Prosperity Now conducted a national survey of lower-income households to better understand the circumstances these households are confronted with and the strategies they use to secure resources to navigate this crisis.

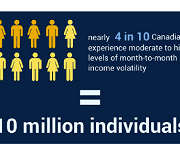
In this report, the JPMorgan Chase Institute uses administrative bank account data to measure income and spending volatility and the minimum levels of cash buffer families need to weather adverse income and spending shocks. Inconsistent or unpredictable swings in families’ income and expenses make it difficult to plan spending, pay down debt, or determine how much to save. Managing these swings, or volatility, is increasingly acknowledged as an important component of American families’ financial security. This report makes further progress toward understanding how volatility affects families and what levels of cash buffer they need to weather adverse income and spending shocks.


This report presents findings from the second annual U.S. Financial Health Pulse, which is designed to explore how the financial health of people in America is changing over time. The annual Pulse report scores survey respondents against eight indicators of financial health -- spending, bill payment, short-term and long-term savings, debt load, credit score, insurance coverage, and planning -- to assess whether they are “financially healthy,” “financially coping,” or “financially vulnerable”. The data in the Pulse report provide critical insights that go beyond aggregate economic indicators, such as employment and market performance, to provide a more accurate picture of the financial lives of people in the U.S.


This report provides a view into the state of financial well-being in America. It presents results from the National Financial Well-Being Survey, conducted in late 2016. The findings include the distribution of financial well-being scores for the overall adult population and for selected subgroups, which show that there is wide variation in how people feel about their financial well-being. The report provides insight into which subgroups are faring relatively well and which ones are facing greater financial challenges, and identifies opportunities to improve the financial well-being of significant portions of the U.S. adult population through practice and research.

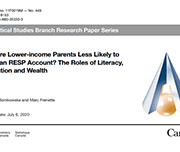
Parents can save for their children's postsecondary education by opening and contributing to a Registered Education Savings Plan (RESP) account, which provides tax and other financial incentives designed to encourage participation (particularly among lower-income families). While the share of parents opening RESP accounts has increased steadily over time, as of 2016, participation rates remained more than twice as high among parents in the top income quartile (top 25%) compared with those in the bottom quartile. This study provides insight into the factors behind the gap in (RESP) participation between higher and lower-income families.


Despite the well-documented connection between health and wealth, investing in this intersection is still a new approach for many grantmakers. With the goal of inspiring increased philanthropic attention, exploration, and replication, this new spotlight elevates responsive philanthropic strategies that support both health and wealth. This report focuses on the in utero-toddler stage of the life cycle (0-3 years). This age segment has some health-wealth integration activity, primarily through two-generation approaches. The goal is to inspire more philanthropic investment for this cohort by highlighting research and examples and offering recommendations.

This report examines the financial health and vulnerability of households in Canada’s 35 largest cities, using a new composite index of household financial health at the neighbourhood level, the Neighbourhood Financial Health Index or NFHI. The NFHI is designed to shine a light on the dynamics underlying national trends, taking a closer look at what is happening at the provincial/territorial, community and neighbourhood levels. Update July 22, 2022: Please note that the Neighbourhood Financial Health Index is no longer available


This report examines data from the Federal Reserve System’s 2016 Survey of Consumer Finances to understand how the wealth of median Black, Latino and White families have changed since the findings of its previous survey were released in 2013.

This report from Prosperity Now shows the importance of matched savings programs called 'Promise Accounts' which help families successfully save for their futures. They are especially important for households of color as compared to white households. Decreasing economic inequality and closing the racial wealth divide means creating saving pathways for low-income households to build wealth. Promise Accounts make some key changes to traditional matched savings programs. Specifically, these accounts would have features including:
Using data from the Survey of Financial Security (SFS), this article looks at changes in debt, assets and net worth among senior Canadian families over the period from 1999 to 2016. It also examines changes in the debt-to income ratio and the debt to-asset ratio of senior families with debt. This study finds that the proportion of senior families with debt increased from 27% to 42% between 1999 and 2016.

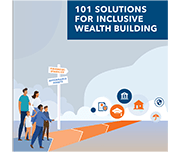
To address challenges around savings, the asset building and financial services fields have developed an array of solutions that attempt to support savings and wealth accumulation. However, the landscape of savings solutions is complex, difficult for households to navigate, and full of solutions that are not designed specifically for low-income and low-wealth households. This brief examines the savings challenges that households face, their underlying causes, and a vision for new solutions.

This article in the Economic Insights series from Statistics Canada examines the economic well-being of millennials by comparing their household balance sheets to those of previous generations of young Canadians. Measured at the same point in their life course, millennials were relatively better off than young Gen-Xers in terms of net worth, but also had higher debt levels. Higher values for principal residences and mortgage debt mainly explain these patterns. Financial outcomes varied considerably among millennial households. Home ownership, living in Toronto or Vancouver, and having a higher education were three factors associated with higher net worth.

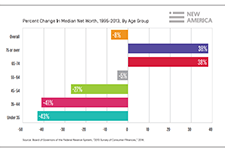
Young adulthood is the life stage when the greatest increases in income and wealth typically occur, yet entering into this period during the Great Recession has put Millennials on a different trajectory. As a result, this generation will need to make very large gains in the years ahead to compensate for these shortfalls. Understanding the dynamics of how the recession has impaired the financial outlook of Millennials, such as identifying how far behind they are compared to previous
generations of young adults, the impact of the recession on their current wealth holdings and earning potential, and the pace at which they’re recovering, is essential to developing appropriate policy interventions that can put them back on track.
Canada ranks consistently as one of the best places to live in the world and one of the wealthiest. When it comes to looking at the financial health of Canadian households, however, we are often forced to rely on incomplete measures, like income alone, or aggregate national statistics that tell us little about the distribution of financial health and vulnerability in our neighbourhoods, communities or provinces/territories. The purpose of this report is to examine the financial heath and vulnerability of Canadian households in different provinces and territories using a new composite index of household financial health, the Neighbourhood Financial Health Index or NFHI. The NFHI has been designed to shine a light on the dynamics underlying these national trends, taking a closer look at what is happening at the provincial/territorial, community and neighbourhood levels. Update July 22, 2022: Please note that the Neighbourhood Financial Health Index is no longer available


Who Pays: A Distributional Analysis of the Tax Systems in All Fifty States (the sixth edition of the report) is the only distributional analysis of tax systems in all 50 states and the District of Columbia. This comprehensive report assesses tax fairness by measuring effective state and local tax rates paid by all income groups. No two state tax systems are the same; this report provides detailed analyses of the features of every state tax code. It includes state-by-state profiles that provide baseline data to help lawmakers and the public understand how current tax policies affect taxpayers at all income levels.
In this presentation Catherine Van Rompaey of Statistics Canada examines the data we have available to measure financial instability in Canada - household debt, savings, and credit. This presentation was given at the Prosper Canada Policy Research Symposium on March 9, 2018. Read the slide deck that accompanies this presentation. Pour lire les diapositives de la présentation, cliquez ici. View the full video playlist of all presentations from this symposium.

In this video presentation Andrew Heisz from Statistics Canada explains the changing household assets, debt, and income levels of Canadians of different age generations. This presentation was given at the Prosper Canada Policy Research Symposium on March 9, 2018. Read the slide deck that accompanies this presentation. View the full video playlist of all presentations from this symposium.
In this video presentation Ray Boshara of the Federal Reserve Bank of St. Louis explains how household financial stability has changed in the United States. He shows how education, age, and racial identity influence financial stability and wealth. This presentation was given at the Prosper Canada Policy Research Symposium on March 9, 2018. Read the slide deck that accompanies this presentation. Pour lire les diapositives de la présentation, cliquez ici. View the full video playlist of all presentations from this symposium.

This is the second in a series of briefs produced by a partnership between the Aspen Institute’s Expanding Prosperity Impact Collaborative (EPIC), Washington University’s Center for Social Development (CSD), and the Intuit Tax and Financial Center. The first brief highlighted new data on the prevalence of income and expense volatility in low- and moderate-income households. This brief will focus on the potential consequences of volatility and how it relates to financial behavior.