Resources
Supported tax filing (STF) model general documents
This section contains resources that describe the supported tax file model and includes sample scripts and documents relevant to both virtual and in-person supported tax filing. These documents may be customized for your own agency.
Resources specific to in-person supported tax filing
This section contains documents that have been tailored for in-person supported tax filing.
Resources specific to virtual supported tax filing
This section contains documents that have been tailored for virtual supported tax filing.
Additional resources
This section contains additional resources to support at tax time. Be sure to also review our Tax filing toolkit and Financial Coaching toolkit for other relevant resources.
Sample client profiles (WoodGreen)
Common tax deductions
Common sources of income and their tax slips
Notice of Assessment – how to read it
Encouraging tax filing at virtual clinics
Housing law: free legal information
This resource produced by Community Legal Education Ontario (CLEO) provides a list of free legal information about paying rent, eviction procedures and much more.
More Canadians are finding it difficult to meet food, shelter and other necessary expenses
In 2022, the Consumer Price Index rose 6.8%, the highest increase since 1982 (+10.9%). Prices for day-to-day goods and services such as transportation (+10.6%), food (+8.9%) and shelter (+6.9%) rose the most. Canadians felt the impact of rising prices. Data from the Canadian Social Survey (CSS) show that the share of persons aged 15 and older living in a household experiencing difficulty meeting its necessary expenses trended upward from just under one-fifth (19%) in the summer of 2021 to just under one-quarter (24%) in the summer of 2022. By the end of 2022, more than one-third (35%) of the population lived in such a household.
English
Dealing with debt: Tips and tools to help you manage your debt
Dealing with debt – About this resource
DWD Worksheet #1 – Your money priorities – Fillable PDF
DWD Worksheet #2: What do I owe? – Fillable PDF
DWD Worksheet #3: Making a debt action plan – Fillable PDF
DWD Worksheet #4: Tracking fluctuating expenses – Fillable PDF
DWD Worksheet #5: Making a spending plan – Fillable PDF including calculations
DWD Worksheet #6: Your credit report and credit score – Fillable PDF
DWD Worksheet #7: Know your rights and options
Dealing with debt – Full booklet

Dealing with debt: Training tools
Resources
Managing debt , Ontario Securities Commission
Options you can trust to help you with your debt, Office of the Superintendent of Bankruptcy Canada
Debt advisory marketplace/ consumer awareness, Office of the Superintendent of Bankruptcy Canada
French
Gestion de la dette: Conseils et outils pour vous aider à gérer votre dette
01 – Vos priorités financières
02 – Combien ai-je de dettes?
03 – Faire un plan d’action
04 – Suivi des dépenses variables
05 – Faire un plan de dépense
06 – Dossier de crédit et cote de solvabilité
07 – Connaître nos droits et nos options
Ressources : Pour en savoir plus
Gestion de la dette : Livret complet

Ressources
Gestion de la dette, La Commission des valeurs mobilières de l’Ontario
Des options fiables pour vous aider avec vos dettes, Bureau du surintendant des faillites
Marché des services-conseils en redressement financier et sensibilisation des consommateurs, Bureau du surintendant des faillites
Resources
Presentation slides and video time stamps
Read the presentation slides for this webinar.
Time stamps for the video recording:
-
- 5:20 – Start
- 6:12 – Land acknowledgement
- 7:24 – Introduction of speakers
- 9:42 – Today’s presentation
- 10:45 – Barriers to access to benefits
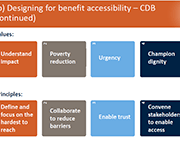
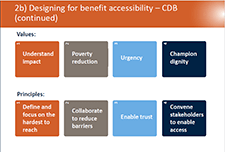
- 15:12 – Designing for benefit accessibility
- 21:53 – ESDC pilot project
- 32:46 –Demo of the disability benefit compass
- 44:36 – Importance of evaluation
- 50:58 – What’s next? What’s possible?
- 58:55 – Questions
Welfare in Canada, 2021
Using data provided by provincial and territorial government sources, Welfare in Canada, 2021 describes the components of welfare incomes, how they have changed from previous years, and how they compared to low-income thresholds. Access the report here. During the launch event, the report’s authors, Jennefer Laidley and Mohy Tabbara, broke down the latest welfare income data from all 13 provinces and territories and presented the key takeaways. Recorded on November 24, the Welfare in Canada, 2021 launch event started with a brief presentation of the report’s key findings, followed by a panel discussion. Presenters: Moderator:
Resources
Presentation slides, handouts, and video time-stamps
Read the presentation slides for this webinar.
Download the handout for this webinar: Flyer for ‘Redefining Financial Vulnerability in Canada: The Embedded Experience of Households’.
Time-stamps for the video recording:
3:31 – Agenda and Introductions
7:15 – Redefining financial vulnerability in Canada (speaker: Jerry Buckland and Brenda Spotton Visano)
24:33 – Audience poll question 1
27:07– Audience poll questions 2 & 3
33:57 – Audience poll question 4
38:00 – Financial Empowerment (Speaker: Margaret Yu)
52:15– Q&A
Social prescribing: A holistic approach to improving the health and well-being of Canadians
Social prescribing is a means of connecting people to a range of community services and activities to improve their health and well-being. These services vary based on each person’s needs and interests, and can include food subsidies, transportation, fitness classes, arts and culture engagement, educational classes, peer-run social groups, employment or debt counseling, and more. Social prescribing is a holistic approach to healthcare that looks to address the social determinants of health, which are the non-medical factors that play a role in an individual’s overall health. These factors may include socioeconomic status, social inclusion, housing, and education.
Canadian Institute for Social Prescribing
The Canadian Institute for Social Prescribing (CISP) is a new national hub to link people and share practices that connect people to community-based supports and services that can help improve their health and wellbeing.
How Canadians bank
Banks in Canada are meeting the evolving preferences of their customers as powerful new technologies change the way people bank and how they pay for goods and services. Banking is transforming at a record pace, bringing innovation and new potential to empower Canadians’ lives in a digital world. This survey and other findings form the basis of How Canadians Banks, a biannual study by the Canadian Bankers Association and Abacus Data that examines the banking trends and attitudes of Canadians.
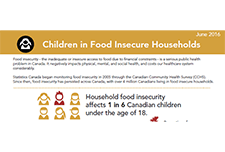
Household Food Insecurity in Canada, 2017-2018
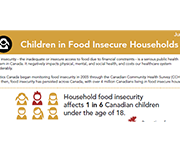
Food insecurity – inadequate or uncertain access to food because of financial constraints – is a serious public health problem in Canada, and all indications are that the problem is getting worse. Drawing on data for 103,500 households from Statistics Canada’s Canadian Community Health Survey conducted in 2017 and 2018, we found that 12.7% of households experienced some level of food insecurity in the previous 12 months. There were 4.4 million people, including more than 1.2 million children under the age of 18, living in food-insecure households in 2017-18. This is higher than any prior national estimate.
Recognizing and responding to economic abuse
With speakers from CCFWE, Johannah Brockie - Program Manager for Advocacy and System Change and Jessica Tran - Program Manager for Education and Awareness, this webinar will guide you through the definition of economic abuse, how to identify an economic abuser, impacts of economic abuse, Covid-19 impacts, tactics, what you should do if you are a victim of economic abuse, and key safety tips. Economic Abuse occurs when a domestic partner interferes with a partner’s access to finances, employment or social benefits, such as fraudulently racking up credit card debt in their partner’s name or preventing their partner from going to work has a devastating effect on victims and survivors of domestic partner violence, yet it’s rarely talked about in Canada. It’s experienced by women from all backgrounds, regions and income levels but women from marginalized groups, including newcomers, refugees, racialized and Indigenous women, are at a higher risk of economic abuse due to other systemic factors.
Resources
Opening and Welcome
Session: Tackling pandemic hardship: The financial impact of COVID-19 on low-income households
Tackling pandemic hardship: The financial impact of COVID-19 on low-income households – YouTube
Download summary and detailed reports: The financial resilience and financial well-being of Canadians with low incomes: insights and analysis to support the financial empowerment sector
Download slide deck: The differential impact of the pandemic on low income families
Booth Chats: Big ideas for a more equitable recovery
Resolve Financial and Credit Counselling
Video Pitch: Booth chat: Jeri Bittorf, Resolve Financial and Credit Counselling Services Coordinator – YouTube
Slide Deck: K3C Credit Counselling (ablefinancialempowerment.org)
Seniors Financial Empowerment Network
Video Pitch: Booth Chat: Sarah Ramsey, City of Edmonton, Community Development Social Worker – YouTube
Seneca College
Video Pitch: Booth Chat: Varinder Gill, Seneca College, Professor & Program Co-ordinator – YouTube
Prosper Canada: Integrating Financial Empowerment into Ontario Works
Video Pitch: Booth Chat: Ana Fremont, Prosper Canada Manager, Program Delivery and Integration – YouTube
Slide Deck: Thunder Bay Financial Empowerment Integration (ablefinancialempowerment.org)
Prosper Canada: Prosperity Gateways – Cities for Financial Empowerment, Toronto Public Library
Video Pitch: Booth Chat: John Stephenson, Manager, Program Delivery and Integration – YouTube
Slide Deck: PowerPoint Presentation (ablefinancialempowerment.org)
Session: Measuring the divide: Has COVID-19 widened economic disparities for Canada’s BIPOC communities
Download slide deck: Income Support During COVID-19and ongoing challenges
Download slide deck: Re thinking income adequacy in the COVID-19 recovery
Session: Financial wellness and healing: Can building financial wellness help Indigenous communities?
Session recording: Financial wellness and healing: Can building financial wellness help Indigenous communities? – YouTube
Download slide deck: Indigenous Financial Literacy: Behaviour Insights from an Indigenous Perspective
Download slide deck: Financial wellness and Indigenous Healing
Session: When money meets race: Addressing systemic racism through financial empowerment
Session: Tous ensemble maintenant : Rétablissement de la santé financière de la population canadienne : l’affaire de tous les secteurs/ All together now: How all sectors have a role to play in rebuilding Canadians’ financial health
Session: When opportunity knocks: Poverty, disability, and Canada’s proposed new disability benefit
Session recording unavailable
Download slide deck: When Opportunity Knocks: Disability without Poverty
Session: The good, the bad and the innovation: The pandemic redesign of tax filing and benefit assistance
Closing remarks from Adam Fair, Vice President, Strategy and Impact, Prosper Canada; Helen Bobiwash
Asset resilience of Canadians, 2019
Canadians were more asset resilient just prior to the pandemic than they were at the turn of the millennium. That resilience continues to be tested as we enter the second year of the pandemic. For the purposes of this article, a household is asset resilient when it has liquid assets that are at least equal to the after-tax, low-income measure (LIM-AT) for three months. To be deemed asset resilient in 2019, a person living alone would require liquid assets of approximately $6,000. A household of four would require $12,000 or $3,000 per person to meet the minimum LIM-AT threshold for three months. Recent Statistics Canada data have shown that savings rose sharply during the pandemic, despite the economic upheaval, and that those in the lower income quintiles have seen their income rise as a result of government support programs, such as the Canada Emergency Response Benefit (CERB). Although the data in this release predate the pandemic, they provide an important benchmark to monitor the economic well-being of Canadian households during a time of unprecedented change.
A statistical portrait of Canada’s diverse LGBTQ2+ communities
Statistics Canada presents a demographic and social profile of Canada's diverse LGBTQ2+ communities based on published analyses. Much of the data in this release focus on LGB Canadians (lesbian, gay, bisexual), since Statistics Canada has been collecting detailed information on these communities since 2003.
Low-income persistence in Canada and the provinces
Each year, some Canadians fall into low income, while others rise out of it. For example, over one-quarter (28.1%) of Canadians who were in low income in 2017 had exited it by 2018. This study examines the low income exit rate in Canada—an indicator that can be used to track the amount of time it takes for people to rise out of low income. Although a potential surge in low income in 2020 as a result of the COVID-19 pandemic was avoided by temporary government support programs, the rising long-term unemployment rate in 2021 suggests a possible increase in poverty and low-income persistence in the future.
Resources
Project reports, journey maps, and toolkit
Reports
These slide decks describe the goals and outcomes of this project.
Socialization deck: Supporting the design of a remote financial help service (Bridgeable)
Client Journey maps
These journey maps offer a visual explanation of the process used by the 3 participating community agencies offering one-on-one client support.
Family Services of Greater Vancouver
SEED Winnipeg
Thunder Bay Counselling
Toolkit
This toolkit was developed in collaboration with community partners, and shares tools for coaches and clients in the virtual one-on-one process.
Virtual service delivery tools (Toolkit)
Living your retirement
These resources from the Ontario Securities Commission are oriented towards planning for retirement. Resources include tips on insurance planning, government benefits, RRSP calculator, and more.
Resources
Webinar (May 19th): Self-care for practitioners - strategies and challenges
Connect and Share (May 27th): Self-care strategies
Webinar (June 9, 2021): Virtual one-on-one client support
Read the slides for the ‘Virtual one-on-one client support’ webinar.
Watch the video recording for ‘Virtual one-on-one client support’
Download the handouts:
Client tool: Information to remember
Tip sheet: Supporting client intake, triage, and referral in virtual financial help services
Financial coaching at a distance: Tips for practitioners
Connect and Share (June 17, 2021): Tax-time debrief
Read the slides for ‘Connect and Share: Tax time debrief’.
View additional resources in Prosper Canada’s Tax filing toolkit.
Workshop (June 21, 2001): Beyond bubble baths - self-care during a pandemic
Workshop slides: Beyond bubble baths – self-care during a pandemic
Handout: Beyond bubble baths – Self-care during a pandemic
Resources shared during session:
Native-land.ca
Indigenous languages list in British Columbia
Self-compassion.org
Tara Brach mindfulness resources
Headspace
Boho beautiful guided meditations
Webinar (June 23, 2021): Diversity and inclusion - A conversation with SEED Winnipeg
Workshop (June 24, 2021): Visualizing client experiences - Using journey maps
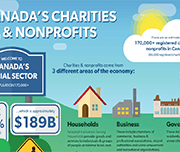
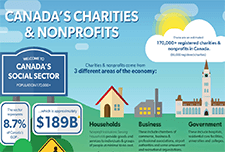
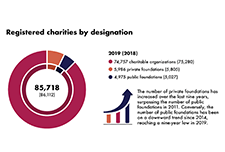
Canada’s Charities & Nonprofits
This infographic shows the size, scope, and economic contribution of charities and nonprofits across Canada.
Unconnected: Funding Shortfalls, Policy Imbalances and How They Are Contributing to Canada’s Digital Underdevelopment
Control, Sufficiency, and Social Support Lessons from Low-income Canadians about Financial Wellbeing
This report examines how diary participants achieve the financial wellbeing that they have. The evidence we found is that low-income people work very hard to manage their finances. They endeavor to control their finances so that, as one participant said, their finances don’t control them. They must prioritize needs and wants because there is not enough for both. One participant talked about her goal of having a ‘little bit more’ than her needs so that there was a little extra for savings or small purchases or trips. Finally, we saw that family and friends are terribly important for achieving financial wellbeing because social supports can provide loans, gifts, and emotional support. Having a low-income means that banks offer few financial supports. Of course, family and friends also make demands.
The Differential Impact of the Pandemic and Recession on Family Finances
This report summarizes the results of a follow-up survey with nineteen low- and modest-middle income Winnipeggers, undertaken in June through September 2020. These respondents were drawn from the 29 Canadian Financial Diaries (CFD) participants who completed a year-long diary in 2019. The results of the survey illustrate that low- and moderate-income earners are feeling stressed with increased expenses and uncertainty about future economic stability.
Proposals for a Northern Market Basket Measure and its disposable income
As stated in the Poverty Reduction Act, the Market Basket Measure (MBM) is now Canada’s Official Poverty Line. The Northern Market Basket Measure (MBM-N) is an adaptation of the MBM that reflects life and conditions in two of the territories – Yukon and Northwest TerritoriesNote. As with the MBM, the MBM-N is comprised of five major components: food, clothing, transportation, shelter and other necessities. The MBM-N is intended to capture the spirit of the existing MBM (i.e., represent a modest, basic standard of living) while accounting for adjustments to the contents of the MBM to reflect life in the North. This discussion paper describes a proposed methodology for the five components found in the MBM-N, as well as its disposable income. This discussion paper also provides an opportunity for feedback and comments on the proposed methodology of the MBM-N.
Budget 2021: A Recovery Plan for Jobs, Growth, and Resilience
The federal budget released on April 19, 2021 covers the Canadian government's plan for:
Financial Relief Navigator
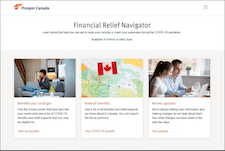
The Financial Relief Navigator is an online tool that can help you find support to raise your income or lower your expenses in these challenging times. The tool will suggest income benefits or other support programs you may be eligible for in your province/territory in Canada.
Measuring Health Equity: Demographic Data Collection in Health Care
The Toronto Central Local Health Integration Network (Toronto Central LHIN) provided financial support to establish the Measuring Health Equity Project and has called for recommendations on health equity data use and a sustainability approach for future data collection. This report describes the journey Toronto Central LHIN and Sinai Health System have taken to embed demographic data collection in hospitals and Community Health Centres. It also summarizes the potential impact of embedding demographic data collection into Ontario health-care delivery and planning. And finally, it describes the use of this data, the lessons learned, and provides recommendations for moving forward.
Colour of Poverty – Colour of Change
There is a growing "colour-coded" inequity and disparity in Ontario that has resulted in an inequality of learning outcomes, of health status, of employment opportunity and income prospects, of life opportunities, and ultimately of life outcomes. Colour of Poverty-Colour of Change believes that it is only by working together that we can make the needed change for all of our shared benefit These fact sheets provide data to help understand the racialization of poverty in Ontario.
Roadblocks and Resilience
This report, Roadblocks and Resilience Insights from the Access to Benefits for Persons with Disabilities project, provides insights on the barriers people with disabilities in British Columbia face in accessing key income benefits. These insights, and the accompanying service principles that participants identified, were obtained by reviewing existing research, directly engaging 16 B.C. residents with disabilities and interviewing 18 researchers and service providers across Canada. We will use these insights to inform development and testing of a pilot service to support people with disabilities to access disability benefits. The related journey map Common steps to get disability benefits also illustrates the complexities of this benefits application process. This journey map illustrates the process of applying for the Disability Tax Credit. The journey map Persons with Disability (PWD) status illustrates the process of preparing for and applying for and maintaining Persons with Disabilities Status and disability assistance in B.C.
2021 Reports of the Auditor General of Canada to the Parliament of Canada – Report 4 – Canada Child Benefit
A report from Auditor General Karen Hogan concludes that the Canada Revenue Agency (CRA) managed the Canada Child Benefit (CCB) program so that millions of eligible families received accurate and timely payments. The audit also reviewed the one-time additional payment of up to $300 per child issued in May 2020 to help eligible families during the COVID‑19 pandemic. The audit noted areas where the agency could improve the administration of the program by changing how it manages information it uses to assess eligibility to the CCB. For example, better use of information received from other federal organizations would help ensure that the agency is informed when a beneficiary has left the country. This would avoid cases where payments are issued on the basis of outdated information. To enhance the integrity of the program, the agency should request that all applicants provide a valid proof of birth when they apply for the benefit. The audit also raised the concept of female presumption and noted that given the diversity of families in Canada today, this presumption has had an impact on the administration of the Canada Child Benefit program.
Cross Canada Check-up (updated March 2021)
Canada ranks consistently as one of the best places to live in the world and one of the wealthiest. When it comes to looking at the financial health of Canadian households, however, we are often forced to rely on incomplete measures, like income alone, or aggregate national statistics that tell us little about the distribution of financial health and vulnerability in our neighbourhoods, communities or provinces/territories. The purpose of this report is to examine the financial heath and vulnerability of Canadian households in different provinces and territories using a new composite index of household financial health, the Neighbourhood Financial Health Index or NFHI.
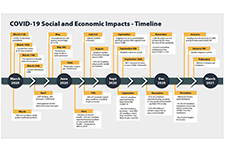
COVID-19 in Canada: A One-year Update on Social and Economic Impacts
This summary provides highlights on the work the Agency has and is undertaking using existing and new data sources to provide critical insights on the social and economic impacts of COVID-19 on Canadians. It covers the first year of the pandemic from March 2020 to March 2021.
Study: Association between food insecurity and stressful life events among Canadian adults
The COVID-19 pandemic and the related business closures and lockdowns have given rise to a series of unprecedented socioeconomic and health-related challenges, one of which is increasing food insecurity. Throughout the pandemic, Statistics Canada has continued to collect and release data on food insecurity in Canada—including exploring the link between food insecurity and mental health, financial stability and Indigenous people living in urban areas. This study looks at the characteristics of food insecure Canadians, focusing on how losing a job, suffering an injury or illness, or a combination of events can increase the risk of food insecurity. This release compares the food security outcomes of two different subpopulations: those who had experienced a stressful life event and those who had not.
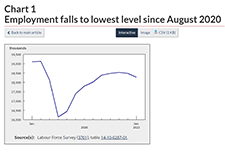
Labour Force Survey, February 2021
February Labour Force Survey (LFS) data reflect labour market conditions during the week of February 14 to 20. In early February, public health restrictions put in place in late December were eased in many provinces. This allowed for the re-opening of many non-essential businesses, cultural and recreational facilities, and some in-person dining. However, capacity limits and other public health requirements, which varied across jurisdictions, remained in place. Restrictions were eased to varying degrees in Quebec, Alberta, New Brunswick, and Nova Scotia on February 8, although a curfew remained in effect in Quebec. In Ontario, previous requirements were lifted for many regions on February 10 and 15, while the Toronto, Peel, York and North Bay Parry Sound health regions remained under stay-at-home orders through the reference week. Various measures were eased in Manitoba on February 12. In contrast, Newfoundland and Labrador re-introduced a lockdown on February 12, requiring the widespread closure of non-essential businesses and services.
The MIX Challenge Toolkit: Tools & Techniques for Challenge-Based Innovation Partnerships & Procurement
The Municipal Innovation Exchange (MIX) project team created this Toolkit to assist municipalities - individual line managers or project owners, or municipal strategic teams (like a Smart Cities Office) - that are contemplating or undertaking a procurement by means of innovation partnership. The Toolkit can help municipal staff decide which projects are a good fit for this approach to procurement. It can help them initiate and manage an innovation partnership. It can also help them assess the whole experience afterwards and determine if and how to apply innovation partnership again.
Social Determinants of Health: The Canadian Facts (2nd edition)
Social Determinants of Health: The Canadian Facts, 2nd edition, provides Canadians with an updated introduction to the social determinants of our health. We first explain how living conditions “get under the skin” to either promote health or cause disease. We then explain, for each of the 17 social determinants of health: Improving the health of Canadians is possible but requires Canadians to think about health and its determinants in a more sophisticated manner than has been the case to date. The purpose of this second edition of Social Determinants of Health: The Canadian Facts is to stimulate research, advocacy, and public debate about the social determinants of health and means of improving their quality and making their distribution more equitable.
10: A Guide for a Community-Based COVID-19 Recovery
Our cities and communities are where people live. It is here we see the effects of public policy and it is here where we will address the issues that matter most to Canadians. The choices made today will impact Canada’s recovery from COVID-19. If we want a future where our cities are thriving, we need to work together to achieve a collective community-based response. We are all in this together and it will take all of us in a community to find our way through. If you are a community leader, such as a mayor, an elected official, a business leader, a community activist, or a concerned citizen, this guide was written for you. We created it to be accessible and easy to use, with five sections and links to resources throughout.
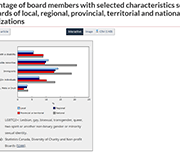
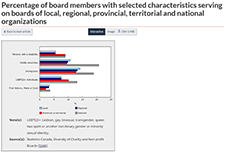
Diversity of charity and non-profit boards of directors: Overview of the Canadian non-profit sector
Charities and non-profit organizations play a vital role in supporting and enriching the lives of Canadians. A crowdsourcing survey of individuals involved in the governance of charities and non-profit organizations was conducted from December 4, 2020, to January 18, 2021. The objectives of the survey were to collect timely information on the activities of these organizations and the individuals they serve and to learn more about the diversity of those who serve on their boards of directors. A total of 8,835 individuals completed the survey, 6,170 of whom were board members.
Labour Force Survey, January 2021
After the December Labour Force Survey (LFS) reference week—December 6 to 12—a number of provinces extended public health measures in response to increasing COVID-19 cases. January LFS data reflect the impact of these new restrictions and provide a portrait of labour market conditions as of the week of January 10 to 16. In Ontario, restrictions already in place for many regions of southern Ontario—including the closure of non-essential retail businesses—were extended to the rest of the province effective December 26. In Quebec, non-essential retail businesses were closed effective December 25 and a curfew implemented on January 14 further affected the operating hours of some businesses. As of the January reference week, existing public health measures continued in Alberta and Manitoba, including the closure of in-person dining services, recreation facilities and personal care services, as well as restrictions on retail businesses. Restrictions were eased between the December and January reference weeks in two provinces. In Prince Edward Island, closures of in-person dining and recreational and cultural facilities were lifted on December 18. In Halifax, Nova Scotia, and the surrounding area, restrictions on in-person dining were eased on January 4.
Canadian Economic News, January 2021 edition
This module provides a concise summary of selected Canadian economic events, as well as international and financial market developments by calendar month. All information presented here is obtained from publicly available news and information sources, and does not reflect any protected information provided to Statistics Canada by survey respondents. This is the issue for January 2021.
Income and mobility of immigrants, 2018
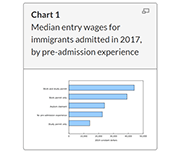
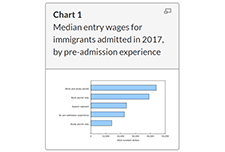
The COVID-19 pandemic has affected many aspects of Canadian immigration, including reduced permanent resident admissions and lower labour market outcomes. This article presents the latest economic and mobility outcomes of immigrants admitted to Canada using data from the 2019 Longitudinal Immigration Database, and provides baseline estimates prior to the pandemic for future analyses. In recent years, the profile of immigrants admitted to Canada has changed. The median entry wage for immigrants admitted to Canada in 2017 was the highest to date, reaching $30,100 in 2018. This value surpassed the previous high of $26,500 for 2017 outcomes of immigrants admitted in 2016. These new data also highlight a decreasing gap between the immigrant median entry wage and the Canadian median wage ($37,400). Factors such as pre-admission experience, knowledge of official languages, and category of admission, among other socioeconomic characteristics, could contribute to the rise in median entry wage compared with previous admission years.
Statistic Canada’s Longitudinal Immigration Database: Birth area and income table, 2018
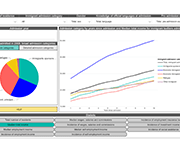
Statistics Canada's Longitudinal Immigration Database (IMDB) Interactive Application has been updated to include data on citizenship intake rates and income by birth area, sex, pre-admission experience and admission category. This table includes income measures up to 2018 for immigrants admitted to Canada since 2008.
Report on the Charities Program 2018 to 2020
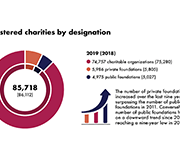
The charitable sector is a major social and economic force, offering vital services to Canadians and people around the world. The Canada Revenue Agency's Charities Directorate employs an education-first approach and client-centric philosophy. It aims to promote compliance with the charity-related income tax legislation and regulations in order to support charitable giving and development of the sector, while protecting charities and the public from abuse. This report provides an update on the Directorate’s activities over the past two years, including the initial impact of the COVID-19 pandemic.
Study: The changing nature of work in Canada amid recent advances in automation technology
While automation has changed the nature of work in Canada over the past few decades, this change was very gradual, and did not accelerate with the very recent developments in artificial intelligence. The results of this study reveal that the share of Canadians working in managerial, professional and technical occupations increased from 23.8% in 1987 to 31.2% in 2018, while the share employed in service occupations increased more moderately from 19.2% to 21.8% over the same timeframe. Jobs in both of these occupational groups are generally difficult to automate. Meanwhile, the share of workers employed in production, craft, repair and operative occupations (more automatable tasks) went from 29.7% in 1987 to 22.2% in 2018, while the share employed in sales, clerical and administrative support occupations also fell over the period (from 27.3% in 1987 to 24.9% in 2018). These jobs are generally more amenable to automation.
Financial Life Stages of Older Canadians
This study, commissioned by the Ontario Securities Commission (OSC) and conducted by the Brondesbury Group, provides some insights on the knowledge that older Canadians have about the financial realities of retirement and how they would apply that knowledge earlier in life if they are able to do so. The top financial concerns and main financial risks of older Canadians are identified for each life stage and how they are being managed are discussed.
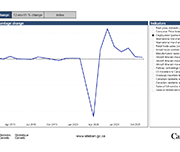
Canadian Economic Dashboard and COVID-19
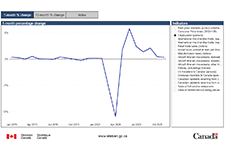
This dashboard presents selected data that are relevant for monitoring the impacts of COVID-19 on economic activity in Canada. It includes data on a range of monthly indicators - real GDP, consumer prices, the unemployment rate, merchandise exports and imports, retail sales, hours worked and manufacturing sales -- as well as monthly data on aircraft movements, railway carloadings, and travel between Canada and other countries.
CPA Canada 2020 Canadian Finance Study
Chartered Professional Accountants of Canada (CPA Canada) has released its comprehensive Canadian Finance Study 2020, which examines people's attitudes and feelings towards their personal finances. The results highlight the new financial realities that Canadians are experiencing during these unprecedented times. Nielsen conducted the CPA Canada 2020 Canadian Finance Study via an online questionnaire, from September 4 to 16, 2020 with 2,008 randomly selected Canadian adults, aged 18 years and over, who are members of their online panel. Among the key pandemic-related findings:
Inter-generational comparisons of household economic well-being, 1999 to 2019
This study of data from the Distributions of Household Economic Accounts compares households' economic well-being from a macro-economic accounts perspective, as measured by net saving and net worth for each generation when the major income earner for a household in one generation reached the same point in the life cycle as the major income earner for a household in another generation. The study finds that while younger generations have higher disposable income and higher consumption expenditure than older generations when they reached the same age, their net saving is relatively similar. As well, younger generations' economic well-being may be more at risk due to the COVID-19 pandemic since they depend more on employment as a primary source of income, they have higher debt relative to income, and they have less equity in financial and real estate assets from which to draw upon when needed.
Gender Results Framework: Data table on core housing need
Statistics Canada's Centre for Gender, Diversity and Inclusion Statistics has released an enhanced data table on the topic of core housing need. These statistics will be used by the Gender Results Framework, a whole-of-government tool designed to track gender equality in Canada. Using data from the 2006 Census of Population, the 2016 Census of Population and the 2011 National Household Survey, the table shows the proportion of the population in core housing need by selected economic family characteristics. This table includes a breakdown by province and territory, age group as well as other demographic characteristics such as population groups designated as visible minorities and Indigenous identity.
A profile of Canadians with a mobility disability and groups designated as visible minorities with a disability
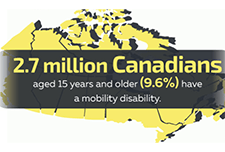
Results from the 2017 Canadian Survey of Disability (CSD) have shown that over half of Canadians with a mobility disability need at least one workplace accommodation. Among population groups designated as visible minorities who have a disability, one-quarter considered themselves to be disadvantaged in employment because of their condition. In recognition of the International Day of Persons with Disabilities, Statistics Canada released three new data products based on findings from the 2017 CSD. One infographic focuses on disabilities related to mobility and another takes a look at visible minorities with disabilities. In addition, two data tables, on industry and occupation of those with and without disabilities, are now available.
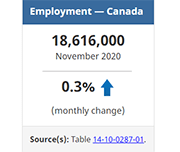
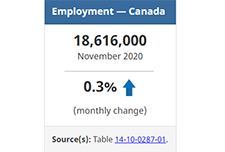
Labour Force Survey, November 2020
November Labour Force Survey (LFS) results reflect labour market conditions as of the week of November 8 to 14. In September and October, many provinces began introducing targeted public health measures in response to rising COVID-19 numbers. In early November, restrictions related to indoor dining and fitness facilities were eased in Ontario, while in Manitoba new measures affecting restaurants, recreational facilities and retail businesses were introduced. Much of Quebec remained at the "red" alert level in November, leading to the ongoing closure of indoor dining and many recreational and cultural facilities.
Resources
Handouts, slides, and video time-stamps
Read the presentation slides for this webinar.
Download the handout for this webinar: Process map: Virtual Self-File model overview
Time-stamps for the video recording:
4:01 – Agenda and introductions
5:59 – Audience polls
10:27 – Project introduction (Speaker: Ana Fremont, Prosper Canada)
14:31 – Tour of TurboTax for Tax Clinics (Speaker: Guy Labelle, Intuit)
17:59 – Woodgreen project pilot (Speaker: Ansley Dawson, Woodgreen Community Services)
27:35 – EBO 2-step process (Speaker: Marc D’Orgeville, EBO)
39:26 – Woodgreen program modifications (Speaker: Ansley Dawson, Woodgreen)
46:03 – Q&A
Office of the Superintendent of Bankruptcy Canada: Statistics and Research
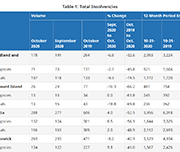
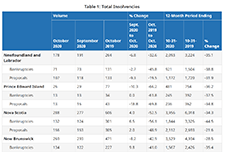
The Office of the Superintendent of Bankruptcy Canada releases statistics on insolvency (bankruptcies and proposals) numbers in Canada. The latest statistics released on November 4, 2020 show that the number of insolvencies in Canada increased in the third quarter of 2020 by 7.9% compared to the second quarter.
Labour Force Survey, October 2020
October Labour Force Survey (LFS) results reflect labour market conditions as of the week of October 11 to 17. By then, several provinces had tightened public health measures in response to a spike in COVID-19 cases. Unlike the widespread economic shutdown implemented in March and April, these measures were targeted at businesses where the risk of COVID transmission is thought to be greater, including indoor restaurants and bars and recreational facilities. Employment increased by 84,000 (+0.5%) in October, after growing by an average of 2.7% per month since May. The unemployment rate was 8.9%, little changed from September. Employment increases in several industries were partially offset by a decrease of 48,000 in the accommodation and food services industry, largely in Quebec.
Labour Force Survey, September 2020
The September Labour Force Survey (LFS) results reflect labour market conditions as of the week of September 13 to 19. At the beginning of September, as Canadian families adapted to new back-to-school routines, public health restrictions had been substantially eased across the country and many businesses and workplaces had re-opened. Throughout the month, some restrictions were re-imposed in response to increases in the number of COVID-19 cases. In British Columbia, new rules and guidelines related to bars and restaurants were implemented on September 8. In Ontario, limits on social gatherings were tightened for the hot spots of Toronto, Peel and Ottawa on September 17 and for the rest of the province on September 19.
Cities Reducing Poverty: 2020 Impact Report
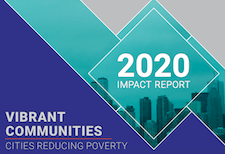
The Vibrant Communities – Cities Reducing Poverty 2020 Impact Report is the Tamarack Institute's first attempt at capturing and communicating national trends in poverty reduction and the important ways in which member Cities Reducing Poverty collaboratives are contributing to those changes. This impact report is meant for poverty reduction organizers and advocates, and public decision-makers to get a sense for how collaborative, multi-sectoral local roundtables with comprehensive plans contribute to poverty reduction in their communities and beyond; and spotlights high-impact initiatives that are demonstrating promising results.
English
French
Resources
Labour Force Survey, August 2020
The August Labour Force Survey (LFS) results reflect labour market conditions as of the week of August 9 to 15, five months following the onset of the COVID-19 economic shutdown. By mid-August, public health restrictions had substantially eased across the country and more businesses and workplaces had re-opened.
Resources
Handouts, slides, and time-stamps
Read the presentation slides for this webinar.
Handouts for this webinar:
Online financial tools and calculators (Prosper Canada)
Virtual tools for participant engagement (Prosper Canada)
Online delivery check-list (Momentum)
Jeopardy game template (SEED)
Time-stamps for the video recording:
3:26 – Agenda and introductions
5:10 – Audience polls
8:19 – Virtual delivery considerations (Speaker: Glenna Harris, Prosper Canada)
12:39 – Virtual workshops best practices (Speaker: Fatima Esmail, Momentum)
33:12 – Online money management training (Speaker: Millie Acuna, SEED)
49:07 – Q&A
Transitions into and out of employment by immigrants during the COVID-19 lockdown and recovery
During the widespread lockdown of economic activities in March and April 2020, the Canadian labour market lost 3 million jobs. From May to July, as many businesses gradually resumed their operations, 1.7 million jobs were recovered. While studies in the United States and Europe suggest that immigrants are often more severely affected by economic downturns than the native born (Borjas and Cassidy 2020; Botric 2018), little is known about whether immigrants and the Canadian born fared differently in the employment disruption induced by the COVID-19 pandemic and, if so, how such differences are related to their socio-demographic and job characteristics. This paper fills this gap by comparing immigrants and the Canadian-born population in their transitions out of employment in the months of heavy contraction and into employment during the months of partial recovery. The analysis is based on individual-level monthly panel data from the Labour Force Survey and focuses on the population aged 20 to 64. Immigrants are grouped into recent immigrants who landed in Canada within 10 years or less, and long-term immigrants who landed in Canada more than 10 years earlier.
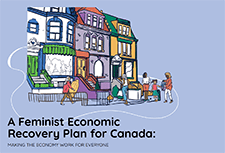
A Feminist Economic Recovery Plan for Canada: Making the Economy Work for Everyone
This report offers an intersectional perspective on how Canada can recover from the COVID-19 crisis and weather difficult times in the future, while ensuring the needs of all people in Canada are considered in the formation of policy.
YWCA Canada and the University of Toronto’s Institute for Gender and the Economy (GATE) offer this joint assessment to highlight the important principles that all levels of government should consider as they develop and implement policies to spur post-pandemic recovery.
Youth Reconnect Program Guide: An Early Intervention Approach to Preventing Youth Homelessness
Since 2017, the Canadian Observatory on Homelessness and A Way Home Canada have been implementing and evaluating three program models that are situated across the continuum of prevention, in 10 communities and 12 sites in Ontario and Alberta. Among these is an early intervention called Youth Reconnect. This document describes the key elements of the YR program model, including program elements and objectives, case examples of YR in practice, and necessary conditions for implementation. It is intended for communities who are interested in pursuing similar early intervention strategies. The key to success, regardless of the approaches taken, lies in building and nurturing community partnerships with service providers, educators, policy professionals, and young people.
Changes in the socioeconomic situation of Canada’s Black population
This study provides disaggregated statistics on the socioeconomic outcomes of the Black population by generation status (and immigrant status), sex and country of origin, and is intended to illustrate and contribute to the relevance of disaggregation in understanding these populations and the diversity of their situation. This study sheds light on some of the issues faced by the Black population and shows differences that exist compared with the rest of the working-age population, by sex, generation and place of origin, from 2001 to 2016.
Your rights at work
This publication explains a worker’s legal rights under the Employment Standards Act regarding hours of work and pay, overtime, breaks, holidays and vacations, and leave from your job. It also has information about how to make a claim against an employer.
Workers’ Compensation: Making a claim
This resource explains what a worker should do if they have a job-related injury or disease, how they can apply for benefits from the Workplace Safety and Insurance Board, and what happens when the Board gets a report of their injury. It also has sections about what their employer must do, and where injured workers can get legal help.
Legal Resources Catalogue: Free legal information
This resource provides a list of free legal information resources produced by Community Legal Education Ontario (CLEO).
New Risks and Emerging Technologies: 2019 BBB Scam Tracker Risk Report
The Better Business Bureau Institute for Marketplace Trust (BBB Institute) is the 501(c)(3) educational foundation of the Better Business Bureau (BBB). BBB Institute works with local BBBs across North America. This report uses data submitted by consumers to BBB Scam Tracker to shed light on how scams are being perpetrated, who is being targeted, which scams have the greatest impact, and much more. The BBB Risk Index helps consumers better understand which scams pose the highest risk by looking at three factors—exposure, susceptibility, and monetary loss. The 2019 BBB Scam Tracker Risk Report is a critical part of BBB’s ongoing work to contribute new, useful data and analysis to further the efforts of all who are engaged in combating marketplace fraud. Update February 24, 2022: BBB Scam Tracker- Risk Report 2020
Canadian Health Survey on Children and Youth, 2019
The current pandemic has reinforced the need for additional information on the health of Canadian children and youth, particularly for those younger than age 12. Results from the new Canadian Health Survey on Children and Youth (CHSCY) indicate that 4% of children and youth aged 1 to 17, as reported by their parents, had fair or poor mental health in 2019, one year prior to the pandemic. The survey also found that poor mental health among children and youth was associated with adverse health and social outcomes, such as lower grades and difficulty making friends. Recently released crowdsourced data suggest that the perceived mental health of Canadian youth has declined during the pandemic, with over half (57%) of participants aged 15 to 17 reporting that their mental health was somewhat worse or much worse than it was prior to the implementation of physical distancing measures.
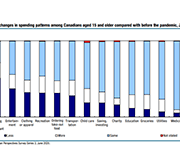
Expected changes in spending habits during the recovery period
Around mid-June, physical distancing measures began easing across the country, giving Canadians more opportunities to spend money. However, COVID-19 is still with us, shopping habits have changed and there are 1.8 million fewer employed Canadians now than there were prior to the pandemic. How our economy evolves going forward will largely depend upon the spending choices Canadians make over the coming weeks and months. This study presents results from a recent web panel survey conducted in June, looks at how spending habits may change.
Shelters for victims of abuse with ties to Indigenous communities or organizations in Canada, 2017/2018
There were 85 shelters for victims of abuse that had ties to First Nations, Métis or Inuit communities or organizations operating across Canada in 2017/2018. These Indigenous shelters, which are primarily mandated to serve victims of abuse, play an important role for victims leaving abusive situations by providing a safe environment and basic living needs, as well as different kinds of support and outreach services. Over a one-year period, there were more than 10,500 admissions to Indigenous shelters; the vast majority of these admissions were women (63.7%) and their accompanying children (36.1%). This article uses data from the Survey of Residential Facilities for Victims of Abuse (SRFVA). Valuable insight into shelter use in Canada and the challenges that shelters and victims of abuse were facing in 2017/2018 is presented.
Costing a Guaranteed Basic Income During the COVID Pandemic
The Parliamentary Budget Officer (PBO) supports Parliament by providing economic and financial analysis for the purposes of raising the quality of parliamentary debate and promoting greater budget transparency and accountability. This report responds to a request from Senator Yuen Pau Woo to estimate the post-COVID cost of a guaranteed basic income (GBI) program, using parameters set out in Ontario’s basic income pilot project. In addition, the report provides an estimate of the federal and provincial programs for low-income individuals and families, including many non-refundable and refundable tax credits that could be replaced by the GBI program.
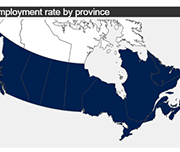
Labour Force Survey in brief: Interactive app
Part of the Canadian Labour Market Observatory, this interactive data visualization application showcases publicly available labour market information. The fully interactive applications allow Canadians to quickly and easily personalize the information in a way that is relevant to them and their interests.
Infographic: COVID-19 and the labour market in June 2020
This infographic displays information on the Canadian labour market in June 2020 as a result of COVID-19.
Labour Force Survey, June 2020
Labour Force Survey (LFS) results for June reflect labour market conditions as of the week of June 14 to June 20. A series of survey enhancements continued in June, including additional questions on working from home, difficulty meeting financial needs, and receipt of federal COVID-19 assistance payments. New questions were added to measure the extent to which COVID-19-related health risks are being mitigated through workplace adaptations and protective measures.
Infographic: The impact of the COVID-19 pandemic on Canadian families and children
This infographic describes parents' experiences during the COVID-19 pandemic including balancing work and schooling, their children's activities and parents' concerns.
Gender differences in mental health during the COVID-19 pandemic
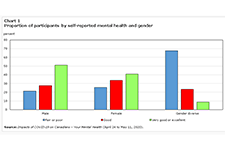
Previous research has demonstrated that the COVID-19 pandemic is negatively affecting the mental health of Canadians. Today, a new study highlights gender differences in the pandemic's impacts on the mental health of participants in a recent crowdsourcing survey, conducted by Statistics Canada from April 24 to May 11, 2020. Around 46,000 Canadian residents participated in this survey. Female participants were more likely than their male counterparts to report "fair" or "poor" self-rated mental health, "somewhat worse" or "much worse" mental health since physical distancing began, and symptoms consistent with moderate or severe generalized anxiety disorder in the two weeks before completing the questionnaire. Female participants were also more likely than male participants to report that their lives were "quite a bit stressful" or "extremely stressful." Gender-diverse participants—that is, participants who did not report their current gender as exclusively female or male—reported poorer mental health outcomes than both female and male participants across all measures.
Economic impact of COVID-19 among visible minority groups
Since visible minorities often have more precarious employment and higher poverty rates than the White population, their ability to adjust to income losses due to work interruptions is likely more limited. Based on a large crowdsourcing data collection initiative, this study examines the economic impact of the COVID-19 pandemic on visible minority groups. Among the crowdsourcing participants who were employed prior to work stoppages, Whites and most visible minority groups reported similar rates of job loss or reduced work hours. However, visible minority participants were more likely than White participants to report that the COVID-19 pandemic had affected their ability to meet financial obligations or essential needs, such as rent or mortgage payments, utilities, and groceries.
Imagine Canada pre-budget consultation toolkit
The House of Commons Finance Committee recently released its call for pre-budget consultation briefs as the government considers its policy priorities for the 2021 federal budget. This toolkit created by Imagine Canada provides information on the reasons to submit a pre-budget consultation brief as well as tips on how to do so.
Economic and Fiscal Snapshot 2020
The COVID-19 crisis is a public health crisis and an economic crisis. The Economic and Fiscal Snapshot 2020 lays out the steps Canada is taking to stabilize the economy and protect the health and economic well-being of Canadians and businesses across the country.
Taxpayer Rights in the Digital Age
This paper explores the intersection of digital innovation, digital services, access, and taxpayer rights in the Canadian context, in light of the experiences of vulnerable populations in Canada, from the perspective of the Taxpayers’ Ombudsman. Many aspects of the CRA’s digitalization can further marginalize vulnerable populations but there are also opportunities for digital services to help vulnerable persons in accessing the CRA’s services.
Reaching Out: Improving the Canada Revenue Agency’s Community Volunteer Income Tax Program
The CVITP provides people, who may otherwise have difficulty accessing income tax and benefit return filing services, with an opportunity to meet their filing obligations. Often, filing a return is required to gain access to, or continue to receive, the government credits and benefits designed to support them. This report illustrates that the CRA needs to take a broad, country-wide perspective of the CVITP, while also taking into consideration regional and other differences. Services offered and training provided to volunteers need to reflect the realities of the diverse regional, geographic, socio-economic, workforce, and vulnerable, sectors throughout Canada. Different areas of the country will have different primary needs from the CVITP. The CRA needs to address those needs, both in its actions through the CVITP, as well as in the training provided to CVITP volunteers and the support given to partner organizations.
Transformation through disruption: Taxpayers’ Ombudsman Annual Report 2019-20
The mandate of the Taxpayers’ Ombudsman is to assist, advise, and inform the Minister about any matter relating to services provided by the CRA. The Taxpayers’ Ombudsman fulfills this mandate by raising awareness, upholding taxpayer service rights, and facilitating the resolution of CRA service complaints issues. Through independent and objective reviews of service complaints and systemic issues, the Ombudsman and her Office work to enhance the CRA’s accountability and improve its service to, and treatment of, people. and systemic issues. This is the Annual Report of the Taxpayers' Ombudsman for 2019-20.
A Pandemic Response and Recovery Toolkit for Homeless System Leaders in Canada
The Pandemic Response and Recovery Toolkit is intended to assist System Leaders plan and navigate the next steps in their community’s response and recovery as it pertains to people experiencing homelessness and people supported in housing programs. The Toolkit outlines phases and action steps – many that have yet to be mobilized - to help with planning, implementation and evaluation of pandemic response and recovery activities in communities. Furthermore, it contains a compendium of resources to help System Leaders along the way. This could be a time of doom and gloom. But there is a silver lining. With innovation and the courage to capitalize on emerging opportunities, the homelessness response and housing support system may emerge from this situation stronger and better than before the pandemic hit. It is possible that we can achieve Recovery for All.
Infographic: An overview of Canadian financial programs for people with disabilities
One in five Canadians are currently living with a disability. This infographic provides an overview of financial programs for people with disabilities in Canada based on findings in Morris et al. (2018) "A demographic, employment and income profile of Canadians with disabilities aged 15 years and over, 2017".
Why are lower-income parents less likely to open an RESP account? The roles of literacy, education and wealth
Parents can save for their children's postsecondary education by opening and contributing to a Registered Education Savings Plan (RESP) account, which provides tax and other financial incentives designed to encourage participation (particularly among lower-income families). While the share of parents opening RESP accounts has increased steadily over time, as of 2016, participation rates remained more than twice as high among parents in the top income quartile (top 25%) compared with those in the bottom quartile. This study provides insight into the factors behind the gap in (RESP) participation between higher and lower-income families.
Low Income Retirement Planning
This booklet contains information on retirement planning on a low income. Topics include four things to think about for low income retirement planning, a background paper on maximizing the Guaranteed Income Supplement (GIS), and determining Old Age Security (OAS) and GIS eligibility for people who come to Canada as adults.
Locked down, not locked out: An eviction prevention plan for Ontario
Social Assistance Summaries
The Social Assistance Summaries series tracks the number of recipients of social assistance (welfare payments) in each province and territory. It was established by the Caledon Institute of Social Policy to maintain data previously published by the federal government as the Social Assistance Statistical Report. The data is provided by provincial and territorial government officials.
Are charities ready for social finance? Investment readiness in Canada’s charitable sector
While social finance could have a transformative impact on the funding and financial landscape, relatively little is understood about its implications for charities. This webinar presents the results of a national survey of over 1,000 registered charities undertaken by Imagine Canada to better understand charities’ current readiness to participate in Canada’s growing social finance market
Volunteering in Canada: Challenges and opportunities during the COVID-19 pandemic
In 2018, over 12.7 million Canadians engaged in formal volunteering, with a total of 1.6 billion hours of their time given to charities, non-profits and community organizations—equivalent to almost 858,000 full-time year-round jobs. Today, Canadians are courageously volunteering in the midst of one of the largest health, economic and social challenges of our lifetime. The study, based upon the 2018 General Social Survey on Giving, Volunteering and Participating, measures the contributions of those who have given their time. While these data are from prior to the COVID-19 pandemic, they provide insight into challenges and opportunities facing volunteerism in the current situation.
Inequality in the feasibility of working from home during and after COVID-19
The economic lockdown to stop the spread of COVID-19 has led to steep declines in employment and hours worked for many Canadians. For workers in essential services, in jobs that can be done with proper physical distancing measures or in jobs that can be done from home, the likelihood of experiencing a work interruption during the pandemic is lower than for other workers. To shed light on these issues, this article assesses how the feasibility of working from home varies across Canadian families. It also considers the implications of these differences for family earnings inequality.
Defining disability for social assistance in Ontario: Options for moving forward
Narrowing the definition of disability used by the Ontario Disability Support Program (ODSP) could have serious implications. Improving the program’s assessment process would yield better results for applicants, Ontario's social safety net, and the government. This report explores the role of ODSP, the risks of narrowing the definition of disability, models of disability assessment from other jurisdictions, and alternative ways that the government could reform the program. Most importantly, the paper recommends that the Ministry focus on improving ODSP’s initial application process. A simplified assessment system would save time and money for applicants, medical professionals, legal clinics, adjudicators, and the Social Benefits Tribunal. These savings should be reinvested back into social assistance.
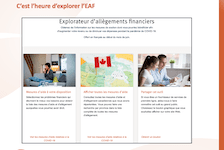
Présentation de l’Explorateur d’allègements financiers (EAF)
L’Explorateur d’allègements financiers : un outil pour connaître les mesures d’aide et d’allègement liées à la COVID-19 dont vos clients pourraient bénéficier En réponse à la pandémie de COVID-19 et en raison de la complexité des mesures d’aide et d’allègement offertes à la population canadienne, nous avons créé l’Explorateur d’allègements financiers (EAF), un outil en ligne qui aide les gens vulnérables au Canada et ceux qui les accompagnent à accéder aux mesures d’aide d’urgence et d’allègement financier proposées par les gouvernements, les établissements financiers, les fournisseurs de services de télécommunication, de services publics et de services Internet. Soyez des nôtres pour assister à notre webinaire d’une heure animé par Elodie Young, de Prospérité Canada, qui vous présentera l’EAF et vous donnera des conseils sur la manière d’aider vos clients à accéder aux mesures d’aide et d’allègement financier. Que vous travailliez dans le secteur de la salubrité des aliments, de la santé mentale, de l'autonomisation financière, de l’établissement ou encore dans le secteur privé, venez apprendre comment aider vos clients à augmenter leur revenu et à réduire leurs dépenses pendant la crise. Ce webinaire concerne tous les fournisseurs de services de première ligne qui gagnent un faible revenu et les populations vulnérables du Canada.
Understanding the perceived mental health of Canadians during the COVID-19 pandemic
While the physical health implications of the COVID‑19 pandemic are regularly publicly available, the mental health toll on Canadians is unknown. This article examines the self-perceived mental health of Canadians during the COVID‑19 pandemic and explores associations with various concerns after accounting for socioeconomic and health factors. Just over half of Canadians aged 15 and older (54%) reported excellent or very good mental health during the COVID‑19 pandemic. Several concerns were also associated with mental health. Notably, after considering the effects of socioeconomic and health characteristics, women, youth, individuals with a physical health condition and those who were very or extremely concerned with family stress from confinement were less likely to report excellent or very good mental health.
Providing one-on-one financial coaching to newcomers: Insights for frontline service providers
One-on-one financial help is a key financial empowerment (FE) intervention that Prosper Canada is working to pilot, scale and integrate into other social services, in collaboration with FE partners across the country. FE is increasingly gaining traction as an effective poverty reduction measure. FE interventions include financial coaching and supports that assist people to build money management skills, access income benefits, tackle debt, learn about safe financial products and services and find ways to save for emergencies. This report shares insights on providing one-on-one financial coaching to newcomers captured through two financial coaching pilot projects that Prosper Canada conducted in collaboration with several frontline community partners.
Supporting Financial Health Fintechs in Canada: Trends, Challenges, and Opportunities
Technology can play a key role in addressing some of the financial challenges that Canadians face on a day-to-day basis. Over the last five to ten years we have seen a growing number of companies, called fintechs, that primarily use technology to change and enhance the way we do banking or access financial advice and services. Many of these companies are building products that are specifically meant to help Canadians improve their financial health. The purpose of this report is to explore the existing financial health fintech landscape in Canada, the challenges that these companies face, and how an accelerator program that provides mentorship and resource supports over a defined time-frame can better help these financial health fintechs grow and thereby help improve the financial health of people across Canada.
Resources
Handouts, slides, and time-stamps
Presentation slides for this webinar
Handouts for this webinar
Introducing the Financial Relief Navigator (FRN)
Access the Financial Relief Navigator here.
Time-stamps for the video recording:
3:22 – Agenda and Introductions
6:00 – Audience poll
9:00 – Why we created the Financial Relief Navigator (Speaker: Janet Flynn)
11:55 – What’s in the Financial Relief Navigator (Speaker: Janet Flynn)
16:35 – FRN Walkthrough using a Persona (Speaker: Galen McLusky)
33:15 – Tips for using the FRN (Speaker: Galen McLusky)
36:00 – The Working Centre experience using the FRN (Speaker: Sue Collison)
41:15 – Q&A
Virtual tax filing: Piloting a new way to file taxes for homebound seniors
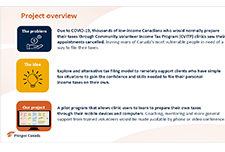
WoodGreen Community Services, a large multi-service frontline social service agency in Toronto, provides free tax preparation services year-round to people living on low incomes. WoodGreen was interested in designing a novel solution to address the tax filing needs of homebound seniors who are unable to access WoodGreen’s free in-person tax-preparation services due to physical or mental health challenges. Specifically, WoodGreen wanted to know… How might we provide high-quality professional tax preparation services to all clients whether or not they are onsite? Prosper Canada and a leading commercial tax preparation software company partnered with WoodGreen Community Services in order to answer this design question.
English
Supported self-file process maps: English
French
English
Benefits 101
What are tax credits and benefits
Reasons to file a tax return
List of common benefits
Getting government payments by direct deposit
Common benefits and credits Benefits pathways (for practitioner reference only – some illustrations presented are Ontario benefits)
Pathways to accessing government benefits
Overview of tax benefits and other income supports (adults, children, seniors)
Overview of tax benefits and other income supports (people with disabilities or survivors)
Income support programs for immigrants and refugees
Glossary of terms – Benefits 101
Resources – Benefits 101
Key benefits you may be eligible for
Make sure you maximize the benefits you are entitled to if you are First Nations, Inuit, or Métis
Benefits of Filing a Tax Return: Infographic
Common benefits and credits
Resource links:
Benefits and credits for newcomers to Canada – Canada Revenue Agency
Benefit Finder – Government of Canada
Electronic Benefits and credits date reminders – Canada Revenue Agency (CRA)
Income Assistance Handbook – Government of Northwest Territories
What to do when you get money from the government – Financial Consumer Agency of Canada (FCAC)
Emergency benefits
General emergency government benefits information & navigation
Financial Relief Navigator tool (Prosper Canada)
Changes to taxes and benefits: CRA and COVID-19 – Government of Canada
Canada Emergency Response Benefit (CERB)
Apply for Canada Emergency Response Benefit (CERB) with CRA – Canada Revenue Agency (CRA)
Questions & Answers on CERB – Government of Canada
What is the CERB? – Prosper Canada
FAQ: Canada Emergency Response Benefit – Prosper Canada (updated June 10th)
CERB: What you need to know about cashing your cheque – FCAC
COVID-19 Benefits (summary, includes Ontario) – CLEO/Steps to Justice
COVID-19 Employment and Work – CLEO/Steps to Justice
GST/HST credit and Canada Child Benefit
COVID-19 – Increase to the GST/HST amount – Government of Canada
Canada Child Benefit Payment Increase – Government of Canada
Benefits payments for eligible Canadians to extend to Fall 2020 – Government of Canada
Support for students
Support for students and recent graduates – Government of Canada
Canada Emergency Student Benefit (CESB) – Government of Canada
Benefits and credits for families with children
Benefits and credits for families with children
Resource links:
Child and family benefits – Government of Canada
Child and family benefits calculator – Government of Canada
Benefits and credits for people with disabilities
Benefits and credits for people with disabilities
RDSP, grants and bonds
Resource links:
Canada Pension Plan disability benefit toolkit – Employment and Social Development Canada (ESDC)
Disability benefits – Government of Canada
Disability tax credit (DTC) – Canada Revenue Agency (CRA)
Free RDSP Calculator for Canadians – Plan Institute
Future Planning Tool – Plan Institute
Creating Financial Security: Financial Planning in Support of a Relative with a Disability (handbook) – Partners for Planning
Nurturing Supportive Relationships: The Foundation to a Secure Future (handbook) – Partners for Planning
RDSP – Plan Institute
Disability Tax Credit Tool – Disability Alliance BC
ODSP Appeal Handbook – CLEO
Disability Inclusion Analysis of Government of Canada’s Response to COVID-19 (report and fact sheets) – Live Work Well Research Centre
Demystifying the Disability Tax Credit – Canada Revenue Agency (CRA)
Benefits and credits for seniors
Benefits and credits for seniors
Resource links:
Canadian Retirement Income Calculator – Government of Canada
Comparing Retirement Savings Options – Financial Consumer Agency of Canada (FCAC)
Federal Provincial Territorial Ministers Responsible for Seniors Forum – Employment and Social Services Canada (ESDC)
Retiring on a low income – Open Policy Ontario
RRSP vs GIS Calculator – Daniela Baron
Sources of income for seniors handout – West Neighbourhood House
What every older Canadian should know about: Income and benefits from government programs – Employment and Social Services Canada (ESDC)
French
Comprendre les prestations
Que sont les crédits d’impôt et les prestations?
Pourquoi produire une déclaration de revenus?
Processus d’accès aux prestations (simple, complexe ou laborieux)
Aperçu des prestations et crédits d’impôt et des autres mesures d’aide au revenu
Aperçu des prestations et crédits d’impôt et des autres mesures d’aide au revenu : personnes handicapées ou survivants
Programmes d’aide au revenu pour immigrants et réfugiés – Admissibilité et processus de demande
Glossaire – Prestations et credits
Ressources : Prestations et credits
Principales mesures d’aide auxquelles vous pouvez être admissibles
Assurez-vous de maximiser les prestations auxquelles vous avez droit si vous êtes Autochtone,
Infographie sur les avantages de produire une déclaration de revenus
Prestations et crédits courants
Prestations et crédits pour familles avec enfants
Prestations et crédits pour personnes handicapées
Prestations et crédits pour les personnes âgées
Informations d’identification pour accéder aux prestations
Études de cas
COVID-19 and support for seniors: Do seniors have people they can depend on during difficult times?
In an effort to avoid the spread of COVID-19, Canadians are engaging in physical distancing to minimize their social contact with others. However, social support systems continue to play an important role during this time. In particular, seniors living in private households may depend on family, friends or neighbours to deliver groceries, medication and other essential items to their homes. This study examines the level of social support reported by seniors living in private households.
Infographic: The impact of COVID-19 on the Canadian labour market
This infographic presents information on the impact of COVID-19 on the Canadian labour market, based from the Labour Force Survey conducted each month. Over three million Canadians were affected by job loss or reduced hours.
Infographic: How are Canadians coping with the COVID-19 situation?
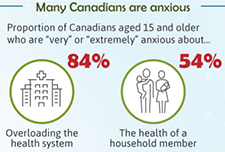
An infographic on the findings from a web panel online survey conducted by Statistics Canada between March 29 and April 3 on how Canadians are responding to the COVID-19 situation. A summary of how many Canadians are feeling anxious, what they are doing during the crisis, and the main precautions that they are taking are presented.
Canadian Perspectives Survey Series 1: Impacts of COVID-19 on job security and personal finances, 2020
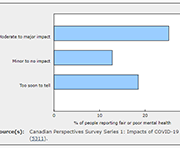
Findings from a web panel survey developed by Statistics Canada on how Canadians are coping with COVID-19. More than 4,600 people in the 10 provinces responded to this survey from March 29 to April 3. In addition to content on the concerns of Canadians and the precautions they took to reduce the risk of exposure to COVID-19, the survey includes questions on work location, perceptions of job security, and the impact of COVID-19 on financial security.
A workplace-based economic response to COVID-19
This brief emerged from a conversation, held in late March 2020, among a number of individuals and organizations who work on issues of household financial security. Employers with financial resources and governments have an opportunity to use the workplace as a significant channel to deliver financial relief as part of the economic response to COVID-19, complementing critical supports governments are providing to individuals and businesses.
Voice of Experience: Engaging people with lived experience of poverty in consultations
COVID-19: Managing financial health in challenging times
This guide from the Financial Consumer Agency of Canada shares guidelines and financial tips to help Canadians during COVID-19. The topics include: getting through a financial emergency, where to ask questions or voice concerns, what to do if your branch closes, and more.
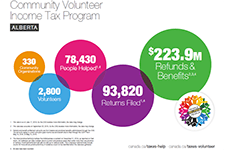
Community Volunteer Income Tax Program (CVITP) provincial snapshots
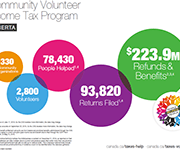
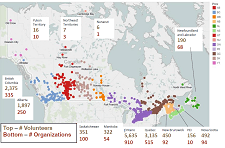
This infographics from the Community Volunteer Income Tax Program (CVITP) show information about the program by province for the tax filing year 2019, including number of returns filed and amount of refunds and benefits accessed. The information is presented in English and French. Les informations sont présentées en anglais et en français.
Canadian Income Survey, 2018
This report from Statistics Canada shares data on median after-tax income and overall poverty rate decline based on 2018 data.
Basic Income: Some Policy Options for Canada
As the need for basic income grows, the Basic Income Canada Network (BICN) is often asked how Canada could best design and pay for it. To answer that in a detailed way, BICN asked a team to model some options that are fair, effective and feasible in Canada. The three options in this report do just that. The three options demonstrate that it is indeed possible for Canada to have a basic income that is progressively structured and progressively funded. BICN wants governments, especially the federal government, to take this seriously—and to act.
Community Benefits of Supportive Housing
This report highlights mostly B.C.-based research and includes key information, facts, and statistics to answer common questions that neighbours, local government, and other stakeholders may have about supportive housing. The easy-to-read question and answer format also includes infographics to showcase the benefits of supportive housing in neighbourhoods across British Columbia and beyond.
Canada Learning Bond – Get $500 for your child’s future
This two-page brochure describes the benefits of acting now to receive $500 to help start saving for a child's education after high school. The brochure is also available in the following Indigenous languages:
Comparison of Provincial and Territorial Child Benefits and Recommendations for British Columbia
First Call BC Child and Youth Advocacy Coalition has been tracking child and family poverty rates in BC for more than two decades. Every November, with the support of the Social Planning and Research Council of BC (SPARC BC), a report card is released with the latest statistics on child and family poverty in BC and recommendations for policy changes that would reduce these poverty levels. This report presents data from the latest report card released by First Call on a cross-Canada comparison of child benefits.
Working Without a Net: Rethinking Canada’s social policy in the new age of work
This report explores the implications of new technologies on Canada’s economy and labour market and the adequacy of current social programs and policies supporting workers.
Infographic: Avoid financial stress, save for emergencies
This infographic illustrates the importance of having an emergency fund and how to build one.
Defining Disposable income in the Market Basket Measure
This paper discusses the concept of disposable income used in the MBM. Disposable income is a measure of the means available to a Canadian family to meet its basic needs and achieve a modest standard of living. The disposable income of families surveyed in the Canadian Income Survey (CIS) is compared to the cost of the MBM basket for the size of the family and the region, and families with disposable incomes below that cost are deemed to be living in poverty.
Financial Health Index: 2019 Findings and 3-Year Trends Report
This report explores consumer financial health, wellness/ stress and resilience for Canadians across a range of financial health indicators, demographics and all provinces excluding Quebec. This report provides topline results from the 2019 Financial Health Index study and three-year trends from 2017 to 2019.
Using Research to Improve the Financial Well-being of Canadians: Post-symposium Report
The Financial Consumer Agency of Canada (FCAC) co-hosted the 2018 National Research Symposium on Financial Literacy on November 26 and 27, 2018 at the University of Toronto, in partnership with Behavioural Economics in Action at Rotman (BEAR). This report presents the key ideas and takeaways from the event, while shining a light on the research shaping new solutions designed to enhance financial well-being in Canada and around the world.
2018 White Paper: Financial Wellbeing Remains Challenged in Canada
The study examines consumers’ financial knowledge and confidence levels; financial and money stressors, financial capability aspects and financial management behaviours and practices (across the financial services spectrum). The study also explores external or environmental factors such as income variability and the extent to which Canadians have access to and lever their social capital (i.e. their family and friends who can provide financial advice and/or support in times of hardship). The study also explores consumer financial product and service usage, debt management and debt stress, access to financial products, services, advice and tools, usage of more predatory financial services (e.g. payday lending) and perceived levels of support by consumers’ primary Financial Institution for their financial wellness. The study also provides benefits of improved support for financial providers improving the financial wellness of their customers – including from a banking share of wallet and brand perspective.
Retirement Literacy Website
The ACPM Retirement Literacy Program complements the financial literacy education efforts by the federal and provincial governments, and other organizations. The website contains a series of quizzes to help improve your knowledge of pensions and retirement savings plans as well as links to financial literacy resources.
The Dynamics of Disability: Progressive, Recurrent or Fluctuating Limitations
Different from common perception, many disabilities do not follow a stable pattern. Persons with disabilities may experience periods of good health in between periods of their limitations and/or experience changes in the severity of their limitations over time. These types of disabilities may be characterized as dynamic because the very nature of the disability is one of change with different possible trajectories over time. As a consequence, the collective experiences of those with disability dynamics are likely to be different than those with so-called “continuous” disabilities. In this paper, four groups of persons with different disability dynamics (or lack of dynamics) are profiled based on data from the 2017 Canadian Survey on Disability. Each group has their own unique demographic, employment, and workplace accommodation profile based on the length of time between periods of their limitations, as well as changes in their limitations over time.
Results from the 2016 Census: Examining the effect of public pension benefits on the low income of senior immigrants
This is a study released by Insights on Canadian Society based on 2016 Census data. Census information on immigration and income is used to better understand the factors associated with low income among senior immigrants. This study examines the factors associated with the low-income rate of senior immigrants, with a focus on access to Old Age Security (OAS) and Guaranteed Income Supplement (GIS) benefits.
Registered Disability Savings Plans (RDSPs) and Financial Empowerment
This policy brief discusses issues surrounding access to Registered Disability Savings Plans (RDSPs) in the province of Alberta and recommended solutions for increasing RDSP uptake. With the Government of Alberta's commitment to improving financial independence for people in the province, suggestions are provided on how to link the government RDSP strategy with financial empowerment collaboratives and champions existing in the province to maximize effectiveness and efficiency.
Canada’s Colour Coded Income Inequality
Canada’s population is increasingly racialized. The 2016 census counted 7.7 million racialized individuals in Canada. That number represented 22% of the population, up sharply from 16% just a decade earlier. Unfortunately, the rapid growth in the racialized population is not being matched by a corresponding increase in economic equality. This paper uses 2016 census data to paint a portrait of income inequality between racialized and non-racialized Canadians. It also looks at the labour market discrimination faced by racialized workers in 2006 and 2016. These data provide a glimpse of the likely differences in wealth between racialized and non-racialized Canadians. This paper also explores the relationship between race, immigration and employment incomes. Taken together, the data point to an unequivocal pattern of racialized economic inequality in Canada. In the absence of bold policies to combat racism, this economic inequality shows no signs of disappearing.
System transformation in Ontario Works: Considerations for Ontario
This paper focuses on proposed system transformation in Ontario Works, and explores the possibilities and limitations associated with the proposed changes in 2018. First, it looks at the broader context within which the government’s social assistance reforms are taking place. Second, it provides an overview of what is known about some of the structural changes in social assistance to date, as well as an overview of experiences in other jurisdictions that have undertaken similar reforms. In conclusion, the paper outlines some key considerations and unresolved questions that the government will need to address before it can move forward with a plan for reform.
Getting Legal Help: A Directory of Community Legal Clinics in Ontario
This resource provides a directory of community legal clinics in Ontario. Community legal clinics provide information, advice, and representation on various legal issues, including social assistance, housing, refugee and immigration law, employment law, human rights, workers' compensation, consumer law, and the Canada Pension Plan. Some legal clinics do not handle all of these issues, but staff may be able to refer you to someone who can help. Community legal clinics are staffed by lawyers, community legal workers, and sometimes law students. Each legal clinic is run by a volunteer board of directors with members from the community. All help is private and confidential and provided free of charge.
Investor Protection Clinic and Living Lab: 2019 Annual Report
The Investor Protection Clinic, the first clinic of its kind in Canada, provides free legal advice to people who believe their investments were mishandled and who cannot afford a lawyer. The Clinic was founded together with the Canadian Foundation for Advancement of Investor Rights (FAIR Canada), an organization that aims to enhance the rights of Canadian shareholders and individual investors. The 2019 Annual Report summarizes the work of The Clinic, including description of the work and types of cases, example case scenarios of the clients who benefited from The Clinic's services, client data and demographics, and recommendations.
Budget Planner
The Financial Consumer Agency of Canada (FCAC)'s online tool helps you create a customized budget.
Welfare in Canada, 2018
These reports look at the total incomes available to those relying on social assistance (often called “welfare”), taking into account tax credits and other benefits along with social assistance itself. The reports look at four different household types for each province and territory. Established by the Caledon Institute of Social Policy, Welfare in Canada is a continuation of the Welfare Incomes series originally published by the National Council of Welfare, based on the same approach.
English
Download in English
French
Download in French
Urban Spotlight: Neighbourhood Financial Health Index findings for Canada’s cities
This report examines the financial health and vulnerability of households in Canada’s 35 largest cities, using a new composite index of household financial health at the neighbourhood level, the Neighbourhood Financial Health Index or NFHI. The NFHI is designed to shine a light on the dynamics underlying national trends, taking a closer look at what is happening at the provincial/territorial, community and neighbourhood levels. Update July 22, 2022: Please note that the Neighbourhood Financial Health Index is no longer available
Emergency Fund Calculator
Some emergencies in life can affect you financially. You could get sick, lose your job, or have a costly repair to your car or home. An emergency fund can provide a financial safety net. Use this calculator to estimate how much money should be set aside to pay for financial emergencies.
Canadians and their money: Key findings from the 2019 Canadian Financial Capability Survey
This report provides results from the 2019 Canadian Financial Capability Survey (CFCS). It offers a first look at what Canadians are doing to take charge of their finances by budgeting, planning and saving for the future, and paying down debt. While the findings show that many Canadians are acting to improve their financial literacy and financial well-being, there are also emerging signs of financial stress for some Canadians. For example, about one third of Canadians feel they have too much debt, and a growing number are having trouble making bill, rent/mortgage and other payments on time. Over the past 5 years, about 4 in 10 Canadians found ways to increase their financial knowledge, skills and confidence. They used a wide range of methods, such as reading books or other printed material on financial issues, using online resources, and pursuing financial education through work, school or community programs. Findings from the survey support evidence that financial literacy, resources and tools are helping Canadians manage their money. For example, those who have a budget have greater financial well-being based on a number of indicators, such as managing cashflow, making bill payments and paying down debt. Further, those with a
financial plan to save are more likely to feel better prepared and more confident about their retirement.
Financial well-being in Canada
Financial well-being is the extent to which you can comfortably meet all of your current financial commitments and needs while also having the financial resilience to continue doing so in the future. But it is not only about income. It is also about having control over your finances, being able to absorb a financial setback, being on track to meet your financial goals, and—perhaps most of all—having the financial freedom to make choices that allow you to enjoy life. The Financial Consumer Agency of Canada (FCAC) participated in a multi-country initiative that sought to measure financial well-being. FCAC conducted this survey to understand and describe the realities of Canadians across the financial well-being spectrum and help policy-makers, practitioners and Canadians themselves achieve better financial well-being. This is in keeping with the Agency’s ongoing work to monitor trends and emerging issues that affect Canadians and their finances.
Canada Education Savings Program: Choosing the right RESP
This printable brochure from the Government of Canada explains the key details you need to know when choosing a Registered Education Savings Plan (RESP) for your child's education savings.
Canada Education Savings Program: Frequently Asked Questions
This fact sheet from the Government of Canada answers Frequently Asked Questions about the Canada Education Savings Plan. This includes details about the Canada Learning Bond, the Canada Education Savings Grant, and Registered Education Savings Plans (RESPs).
Incentivized Savings: An Effective Approach at Tax Time
A tax refund is often the largest amount of money a low-income household will receive throughout the year. It offers a unique opportunity to think long term and save for the future. Thus, in 2018, Momentum launched a new pilot program called Tax Time Savings (TTS), presented by ATB. It was through a dedicated collaboration with ATB Financial, Aspire Calgary, Sunrise Community Link Resource Centre, Centre for Newcomers, and First Lutheran Church Calgary that made it all possible. This report shares results and highlights from the 2018 Tax Time Savings program. 93% of participants earned the maximum match of $500.
Trends in the Citizenship Rate Among New Immigrants to Canada
This Economic Insights article examines trends in the citizenship rate (the percent of immigrants who become Canadian citizens) among recent immigrants who arrived in Canada five to nine years before a given census. The citizenship rate among recent immigrants aged 18 and over peaked in 1996 and declined continuously to 2016. Most of this decline occurred after 2006. The citizenship rate declined most among immigrants with low family income, poor official language skills, and lower levels of education. There was also significant variation in the decline among immigrants from different source regions, with the decline largest among Chinese immigrants.
Resources
Handouts, slides, and time-stamps
Read the presentation slides for this webinar
Access the handouts for this webinar:
Poster presentation: Financial Empowerment for Newcomers project
Infographics: Newcomer settlement stages, money matters, and client personas
Time-stamps for the video recording:
3:11 – Agenda and introductions
5:21 – Audience poll
8:25 – Introduction to Financial Empowerment for Newcomers project (Speaker: Glenna Harris)
11:25 – AXIS financial coaching program (Speaker: Sheri Abbot)
30:05 – North York Community House financial coaching program (Speaker: Noemi Garcia)
45:40 – Q&A
Financial Empowerment for Newcomers: Evaluation insights from pilot project
This fact sheet provides insights from Prosper Canada's Financial Empowerment for Newcomers pilot project conducted with three newcomer-serving organizations, Saskatoon Open Door Society (SODS), AXIS Employment Services (AXIS), and North York Community House (NYCH), who implemented and integrated financial coaching into their existing services for newcomers. The project objectives were to provide newcomer-serving front-line staff with training and resources to enable them to accurately assess newcomers’ financial literacy and connect them to appropriate information and resources and to coach newcomers to achieve successful financial independence.
Financial Empowerment for Newcomers infographic
This infographic displays data gathered from interviewing 53 newcomer participants in three provinces (Saskatchewan, Ontario, and Newfoundland) between August and October 2017. Learn more about the stages of newcomer settlement, key money topics and experiences of newcomers, and three types of newcomer client personas.
My money in Canada
Are you a newcomer to Canada, or someone who works with newcomers? This online tool will help you explore five money modules to better manage your finances in Canada. Learn about the financial system in Canada, income and expenses, setting goals and saving, credit and credit reports, and filing taxes. Updated July 26, 2022: My money in Canada provides important information about Canada’s financial system and promotes positive money management habits to support Canadians to succeed financially. Interactive exercises and checklists support you to make informed choices and to create a customized financial plan that works for you. Originally designed to support newcomers to Canada as they settle and establish themselves financially, My money in Canada has been updated to serve all Canadians, including those who are new to Canada.
RDSP calculator
Enhance the quality of life for a family member with a disability. By answering a few simple questions, the RDSP Calculator can help you project the estimated future value of an RDSP, and the approximate value of future withdrawal payments. Run various scenarios to see how it would affect the value of your RDSP. The RDSP Calculator is a tool to help you assess the potential of opening and contributing to an RDSP. The estimates provided by the Calculator are for information purposes only. The profile of your RDSP may differ from the RDSP Calculator projection.
Money and Youth
The Canadian Foundation for Economic Education (CFEE) works collaboratively with funding partners, departments of education, school boards, schools, educators, and teacher associations to develop and provide free, non-commercial programs and resources for teachers and students – developed and reviewed by educators. The online version of their curriculum Money and Youth is organized into separate modules so that users can select individual topics that align with interests. An introduction to the topic, a teachers guide containing lesson plans, and parent resources are included within each module.
Infographic: The Changing Characteristics of Canadian Jobs
This infographic released by Statistics Canada shows some of the ways the Canadian workforce has changed from 1981 to 2018. Some of these changes include industry, pension coverage, whether jobs are full-time and permanent, and whether they are unionized. These changes have also not been uniform for men and women.
Infographic: New Data on Disability in Canada, 2017
This infographic released from Statistics Canada compiles some of the data collected from the 2017 Canadian Survey on Disability. 22% of Canadians had at least one disability, representing 6.2 million people.
It pays to plan for a child’s education
This fact sheet from ESDC explains how to open an RESP and access the Canada Learning Bond.
Proliteracy.ca: Plan Finances for University or College
Proliteracy.ca analyzes historical living expenses from over 160 cities and tuition from over 100 universities and colleges in Canada to predict the cost of post secondary education in the future. Their tool suggests financing options based on your profile. Learn about RESP, grants, scholarships and various government and commercial programs with their online resources.
Accessing the Canada Learning Bond: Meeting Identification and Income Eligibility Requirements
Not having a Social Insurance Number (SIN) and not filing taxes may represent challenges to access government programs and supports such as the Canada Education Savings Grant (CESG) and the Canada Learning Bond (CLB). Limited data availability has prevented a full assessment of the extent of these access challenges. This study attempts to address this knowledge gap by analyzing overall differences in SIN possession and tax-filing uptake by family income, levels of parental education, family type and Indigenous identity of the child and age of children using the 2016 Census data augmented with tax-filing and Social Insurance Number possession indicator flags.
Canada Revenue Agency Child and Family Benefits Calculator
This online tool released by the Canada Revenue Agency can be used to determine the eligibility and payment amounts of child and family benefits. Additional information on child and family benefit programs may be found on the Canada Revenue Agency's child and family benefits page.
Low income among persons with a disability in Canada
Persons with a disability face a higher risk of low income compared to the overall population. This report uses data from the 2014 Longitudinal and International Study of Adults (LISA) to study the relationship between low income and characteristics of people aged 25 to 64 with a disability, including disability type, severity class, age of onset of disability, family composition, and other risk factors associated with low income. It also examines the composition of the low-income population in relation to disability, and provides information on the relationship between employment and low income for this population.
Does education pay? A comparison of earnings by level of education in Canada and its provinces and territories
This report examines the relationship between the earnings of Canadians in the labour market and their post-secondary education credentials. Findings are based upon information gathered from the 2016 Census on adults between the ages of 25 to 64 with different levels of education and working in different parts of the country.
The Effects of Education on Canadians’ Retirement Savings Behaviour
This paper assesses the extent to which education level affects how Canadians save and accumulate wealth for retirement. Data from administrative income-tax records and responses from the 1991 and 2006 censuses of Canada show that individuals with more schooling are more likely to contribute to a tax-preferred savings account and have higher saving rates, have higher home values, and are less likely to rent housing.
Canadian Financial Diaries
The Canadian Financial Diaries Research Project is using the financial diaries methodology to understand the financial dynamics of vulnerable Canadians in a rapidly changing socio-economic context. This includes understanding the barriers and opportunities that people face in trying to improve their financial and overall well-being. The website shares research insights and news about the project as the different phases of research are synthesized.
Resources
Handouts, slides, and time-stamps
Read the presentation slides for this webinar:
- Prosper Canada: Webinar introduction / Improving the Benefits Screening Tool
- Bridgeable: Introduction to Service Design
Bridgeable’s handouts for this webinar:
Key takeaways for Service Design
Prosper Canada’s handouts for this webinar:
Benefits Screening Tool Phase 2 report
Pathways to benefits
Client Journey Map for ODSP application
Practitioner Workflows
Time-stamps for the video recording:
3:14 – Agenda and introductions
5:51 – Audience polls
9:19 – All about service design (Speaker: Glenna Harris)
11:00 – Bridgeable: Introduction to service design (Speakers: Bonnie Tang and Minyan Wong)
35:00 – Benefits Screening tool design process (Speaker: Trisha Islam)
50:20 – Q&A
Chronic Low Income Among Immigrants in Canada and its Communities
This study examines the rate of chronic low income among adult immigrants (aged 25 or older) in Canada during the 2000s. Data is taken from the Longitudinal Immigration Database (IMDB) for the period from 1993 to 2012, with regional adjustments used for the analysis. Chronic low income is categorized as having a family income under a low-income cut-off for five consecutive years or more. The study found that for immigrants were in in low-income in any given year, half were in chronic low-income. Including spells of low income which become chronic in later years, this number rises to two-thirds. The highest chronic rates were found in immigrant seniors and immigrants who were unattached or lone parents. Chronic low income is a large component of income disparity and overall low income among immigrants.
Backgrounder: Preliminary findings from Canada’s Financial Well-Being Survey
This backgrounder reports preliminary findings from a survey of financial well-being among Canadian adults. Preliminary analysis of the survey data indicates that two behaviours are particularly important in supporting the financial well-being of Canadians. First, our analysis indicates that Canadians who practice active savings behaviour have higher levels of financial resilience as well as higher levels of overall financial well-being. In other words, regardless of the amount of money someone makes, regular efforts to save for unexpected expenses and other future priorities appears to be the key to feeling and being in control of personal finances. Secondly, Canadians who often use credit to pay for daily expenses because they have run short of money have lower levels of financial well-being. While this behaviour is likely symptomatic of low levels of financial well-being, our analysis indicates that a person can substantially improve their financial resilience and financial well-being by implementing strategies to reduce the frequency of running out of money and of having to rely on credit to get by.
Retirement 20/20: The 2019 Fidelity Retirement Survey
The Fidelity Retirement Survey is focused on how Canadians near, and already in, retirement approach the next stage of their lives. This is the 14th year of the survey. The results indicate Canadians are retiring earlier than expected. They also show 46% of pre-retirees expect to have some long-term debt when they retire, and that 70% believe they will be working in retirement, among other results.
Accessing the Canada Learning Bond: Meeting Identification and Income Eligibility Requirements
Introduced in 1998, the Canadian Education Savings Program (CESP) was designed as an incentive to encourage education savings for the post-secondary education of a child. The program is centred on Registered Education Savings Plans (RESPs), where savings accumulate tax-free until withdrawn, to pay for full- or part-time postsecondary studies such as a trade school, CEGEP, college, or university, or in an apprenticeship program. The CLB was introduced in 2004 specifically for children from low income families. CLB provides, without family contribution being required, eligible families with an initial RESP payment which may be followed by annual payments up until the child is aged 15 years old. The objective of this paper is to assess the extent to which not tax-filing and not having a SIN for a child could pose a challenge to accessing the CLB and the CESG. This study will address the knowledge gap by analyzing overall differences in SIN and tax-filing uptake by family income, levels of parental education, family type and Indigenous identity of the child. The findings will help understand access issues related to the CLB but also to other programs with similar administrative conditions. En francais: Accéder au Bon d’études canadien: l’atteinte des critères d’identification et d’éligibilité selon le revenu.
Protecting vulnerable clients: A practical guide for the financial services industry
Firms and representatives in the financial services industry occasionally encounter situations where a client’s vulnerability causes the client to make decisions that are contrary to his or her financial interests, needs or objectives or that leave him or her exposed to potential financial mistreatment. Because of the relationships they develop with their clients and the knowledge they acquire about clients’ financial needs or objectives over time, firms and representatives in the financial sector can play a key role in helping people who are in a vulnerable situation protect their financial well-being. They are instrumental in preventing and detecting financial mistreatment among consumers of financial services. Firms and representatives can also help clients experiencing financial mistreatment get the assistance they need. This guide proposes possible courses of action to protect vulnerable clients. Its purpose is to provide financial sector participants with guidance on the steps they can take to help protect clients’ financial well-being, prevent and detect financial mistreatment, and assist clients who are experiencing this type of mistreatment.
Video: Additional CPP
This short video from the Canadian Pension Plan Investment Board explains the new additional Canada Pension Plan (CPP).
Evaluation of the Guaranteed Income Supplement
The Old Age Security program is the largest statutory program of the Government of Canada, and consists of the Old Age Security pension, the Guaranteed Income Supplement, and the Allowance. The Guaranteed Income Supplement is provided to low-income seniors aged 65 years and over who receive the Old Age Security pension and are below a low-income cut-off level. This evaluation examines take-up of the Guaranteed Income Supplement by various socioeconomic groups, the characteristics of those who are eligible for the Supplement but do not receive it, and barriers faced by vulnerable groups.
Resources
Handouts, slides, and time-stamps
Read the presentation slides for this webinar.
Access the handouts for this webinar:
How we help people – An overview (Webinar handout) – Credit Counselling Society
Our services (Webinar handout) – Credit Counselling Society
Debt solutions 101 (Webinar handout) – msi Spergel Inc
Time-stamps for the video-recording:
4:13 – Agenda and introductions
7:00 – Audience polls
12:31 – Debt in Canada (Speaker: Glenna Harris)
15:20 – Credit Counselling Society on debt management plans (Speaker: Anne Arbour)
34:05 – Spergel Msi on Consumer Proposals and Bankruptcy plans (Speaker: Gillian Goldblatt)
56:00 – Q&A
Debt and assets among senior Canadian families
Using data from the Survey of Financial Security (SFS), this article looks at changes in debt, assets and net worth among senior Canadian families over the period from 1999 to 2016. It also examines changes in the debt-to income ratio and the debt to-asset ratio of senior families with debt. This study finds that the proportion of senior families with debt increased from 27% to 42% between 1999 and 2016.
Mortgage and Consumer Credit Trends Report
The Canada Mortgage and Housing Corporation (CMHC) publishes a quarterly report on Canadian trends relating to mortgage debt and consumer borrowing. Find out the level of Canadian household indebtedness, and emerging trends in outstanding debt balances in different urban areas and by age group.
Are Low-Income Savers Still in the Lurch? TFSAs at 10 Years
The introduction of Tax-Free Savings Accounts (TFSAs) in 2009 transformed how Canadians save. One of the main reasons for creating TFSAs was to provide a taxassisted savings instrument for low-income Canadians to enable them to improve their retirement income. Now, 10 years later, many low-income savers are still not using TFSAs in ways that would allow them to benefit fully from the government transfer programs intended for them in retirement, such as the Guaranteed Income Supplement. Consequently, intended benefits from TFSAs are going untapped. Improving public education and financial literacy may be part of the solution to this problem, but built-in policy nudges and tax adjustments will be more effective.
In sickness and in health: The association between health and household income
This study uses data from the Longitudinal and International Study of Adults (LISA) to analyze the association between health and household income. Using data on both self-reported general health and self-report mental health, as well as self-reported labour-market outcomes and linked tax records, the association between spouse-pair labour-market income and health is further decomposed into an employment effect reflecting the association between health and the probability of employment, an hours worked effect reflecting the association between health and the number of hours worked, and a wage effect reflecting
the association between health and hourly wages.
The income of Canadians
This infographic from Statistics Canada shows the median after-tax income of households, by province, as of 2016. It also shows changes in median government transfers, and number of people living on low incomes according to the after-tax low income measure.
Results from the Survey of Household Spending, 2017 (Infographic)
This infographic from Statistics Canada summarizes the results of the Survey of Household Spending, 2017, including average annual expenditures by household type.
Earnings Inequality and the Gender Pay Gap in Canada
This study from Statistics Canada explores how increases in top earnings and the representation of women among top earners affect the overall gender earnings gap in Canada. Results show that even though the representation of women in top earnings groups increased from 1978 to 2015, their continued under-representation in these groups accounted for a substantial and growing share of the gender gap in total annual earnings.
Infographic: Labour market outcomes for college and university graduates, 2010 to 2014
This infographic from Statistics Canada shows the labour market outcomes for college and university graduates between 2010 and 2014. It shows the median employment income achieved by graduates of different education levels, 2 years and 5 years post-graduation. Overall, it shows that people with higher levels of post-secondary education report higher employment income post-graduation.
Economic Well-being Across Generations of Young Canadians: Are Millenials Better or Worse Off?
This article in the Economic Insights series from Statistics Canada examines the economic well-being of millennials by comparing their household balance sheets to those of previous generations of young Canadians. Measured at the same point in their life course, millennials were relatively better off than young Gen-Xers in terms of net worth, but also had higher debt levels. Higher values for principal residences and mortgage debt mainly explain these patterns. Financial outcomes varied considerably among millennial households. Home ownership, living in Toronto or Vancouver, and having a higher education were three factors associated with higher net worth.
Financial Expectations and Household Debt
This Economic Insights article quantifies the degree to which families who expect their financial situation to get better in the next two years have, all else equal, more debt than comparable families. The study shows that even after a large set of socioeconomic characteristics is controlled for, families who expect their financial situation to improve in the near future have significantly more debt and generally higher debt-to-income ratios than other families.
The Who’s Hungry Report
The Who’s Hungry Report provides quantitative and qualitative data about the experience of hunger and poverty in Toronto. To create the reports, trained volunteers conduct face-to-face interviews with over 1,400 food bank clients at nearly 40 member agencies, collecting demographic data as well as information about the day-to-day experience of living with hunger.
Poverty Trends 2018 report
This annual report on poverty in Canada reports that a staggering 5.8 million people in Canada (or 16.8%) live in poverty. The report uses several low-income indicators, including the Low-Income Measure (LIM), the Census Family Low Income Measure (CFLIM) and the Market Basket Measure (MBM). Each measure of low income provides different information on poverty using different methodologies to calculate rates of poverty.
Mortgage Calculator
This calculator from the Financial Consumer Agency of Canada determines your mortgage payment and provides you with a mortgage payment schedule.
Debt and assets among senior Canadian families, 1999 to 2016
These results are from the new study "Debt and assets among senior Canadian families." released in April 2018. The study examines changes in debt, assets and net worth among Canadian families whose major income earner was 65 years of age or older. In recent years, household debt has increased. The level of debt and value of assets are especially important for the financial security of seniors. Because income typically declines during the retirement years, seniors often need accumulated assets to finance their consumption, especially if they do not benefit from a private pension plan. Debt can also be particularly problematic for seniors as repayment can be more difficult on a reduced income.
The Economic Well-Being of Women in Canada
Economic well-being has both a present component and a future component. In the present, economic well-being is characterized by the ability of individuals and small groups, such as families or households, to consistently meet their basic needs, including food, clothing, housing, utilities, health care, transportation, education, and paid taxes. It is also characterized by the ability to make economic choices and feel a sense of security, satisfaction, and personal fulfillment with respect to finances and employment pursuits. Using Statistics Canada data from a variety of sources, including the Survey of Labour and Income Dynamics, the Canadian Income Survey, the Survey of Financial Security, and the 2016 Census of Population, this chapter of Women in Canada examines women’s economic well-being in comparison with men’s and, where relevant, explores how it has evolved over the past 40 years. In addition to gender, age and family type (i.e., couple families with or without children; lone mothers and fathers; and single women and men without children) are important determinants of economic well-being. Hence, many of the analyses distinguish between women and men in different age groups and/or types of families.
Infographic: Canadian Payroll Association’s 2018 Survey of Employees
This infographic shows results from the 2018 Survey of Employees conducted by the Canadian Payroll Association. It shows some marginal improvements but also some concerns. 44% of Canadians are living paycheque to paycheque, 40% feel overwhelmed by debt, and 72% have saved only one quarter or less of what they feel they'll need to retire. View full suite of news release and infographics from this survey, by province.
NPW 2018 Employee Research Survey
Working Canadians seem to be making some minor progress towards improving their financial health. But, while 66% report being in a better financial position than a year ago, their debt levels remain high, they chronically undersave for retirement, and put themselves at severe risk in the event of economic changes. According to the Canadian Payroll Association’s tenth annual survey, 44% of working Canadians report it would be difficult to meet their financial obligations if their pay cheque was delayed by even a single week (down from the three-year average of 48%). View full suite of news release and infographics from this survey, by province.
Indebtedness and Wealth Among Canadian Households
Understanding the health of the balance sheets of Canadian households is a complex issue that continues to generate considerable discussion. A new Statistics Canada study contributes to these discussions by highlighting the extent to which national measures of indebtedness and wealth mask significant variation across the country. The study is largely based on results from the 2016 Survey of Financial Security (SFS), which allow for a detailed profile by census metropolitan area (CMA) and by income groups.
Pervasive and Profound: The Impact of Income Volatility on Canadians
In this video presentation Derek Burleton of TD Economics shares findings from the report 'Pervasive and Profound,' which examines income volatility trends in Canada. The survey found that nearly 40% of Canadians experience moderate to high income volatility. This presentation was given at the Prosper Canada Policy Research Symposium on March 9, 2018. Read the slide deck that accompanies this presentation. View the full video playlist of all presentations from this symposium.
Resources
Talking to our neighbours: America’s household balance sheets
Household Financial Stability and Income Volatility, Ray Boshara, Federal Reserve Bank of St. Louis
Income volatility: What banking data can tell us, if we ask, Fiona Greig, JP Morgan Chase Institute
Up Close and Personal: Findings from the U.S. Financial Diaries, Rob Levy, CFSI
The good, the bad, and the ugly: Canada’s household balance sheets
Canada’s household balance sheets, Andrew Heisz, Statistics Canada
Income volatility and its effects in Canada: What do we know?
Pervasive and Profound: The impact of income volatility on Canadians, Derek Burleton, TD Economics
Income and Expense Volatility Survey Results, Patrick Ens, Capital One
Neighbourhood Financial Health Index: Making the Invisible Visible, Katherine Scott, Canadian Council on Social Development
What gets inspected, gets respected: Do we have the data we need to tackle household financial instability?
Do we have the data we need to tackle household financial instability?, Catherine Van Rompaey, Statistics Canada
Emerging solutions
Income volatility: Strategies for helping families reduce or manage it, David S. Mitchell, Aspen Intitute
Building consumer financial health: The role of financial institutions and FinTech, Rob Levy, CFSI
Redesigning Social Policy for the 21st Century, Sunil Johal, Mowat Centre
Strengthening retirement security for low- and moderate-income workers, Johnathan Weisstub, Common Wealth
Spotlight on Canadians and Debt: Who’s Vulnerable
Debt-to-income ratios in Canada have continue to rise since the 2008-2009 recession, especially in urban centres where housing prices have increased over the last few years. This infographic from Statistics Canada shows where debt-to-income ratios are highest across Canada.
Resources
Handouts, slides, and time-stamps
Read the presentation slides for this webinar
Handouts for this webinar:
Tax time insights research report – webinar handout (Prosper Canada)
Income tax checklist – webinar handout (The Working Centre)
Form for missing income information – webinar handout (The Working Centre)
Income tax return summary sheet – webinar handout (The Working Centre)
Host checklist for tax clinics – webinar handout (The Working Centre)
Forms for rental information – webinar handout (The Working Centre)
Referral to FEPS – webinar handout (The Working Centre)
Time-stamps for the video-recording:
3:10 – Introductions and Agenda
6:32 – Audience polls
10:52 – Tax time insights: Experiences of people living on low incomes (Speaker: Nirupa Varatharasan)
26:00 – The Working Centre tax clinic experiences (Speaker: Jen Smerdon)
Resources
Barriers to tax filing experienced by people with low incomes
Income tax filing and benefits take-up: Challenges and opportunities for Canadians living on low income, Uttam Bajwa, University of Toronto
Tax time insights, Nirupa Varatharasan, Prosper Canada
“Stories from the field”: Contextualizing the barriers Indigenous People face, Erin Jeffery, Canada Revenue Agency (CRA)
Closing the tax-filing gap: Challenges and opportunities
The Community Volunteer Income Tax Program, Nancy McKenna, CVITP, Canada Revenue Agency
Supporting organizations in the CVITP, Aaron Kozak, Employment and Social Development Canada, and Melissa Valencia, Canada Revenue Agency
A Realist analysis of nonprofit tax filing services, Kevin Schachter, University of Manitoba and SEED Winnipeg
National and regional strategies to boost tax filing
The Community Volunteer Income Income Tax Program, Nancy McKenna, Canada Revenue Agency
GetYourBenefits! Diagnose and Treat Poverty, Dr. Noralou Roos, Manitoba Centre for Health Policy
Get your piece of the money pie, Althea Arsenault, New Brunswick Economic and Social Inclusion Corporation
Innovations in tax filing assistance
Scaling tax filing assistance, John Silver, Community Financial Counselling Service (CFCS)
Virtual Tax Filing Pilot, Radya Cherkaoui, Intuit Canada, and Steve Vanderherberg, Woodgreen Community Services
Innovative use of technology for VITA, German Tejeda,
Virtual Tax Filing Pilot
In this presentation, Radya Chaerkaoui, Senior Product Manager and Innovation Catalyst, Intuit Canada, and Steve Vanderherberg, Director-Strategic Initiatives, WoodGreen Community Services, share insights from their Virtual Tax Filing Pilot program. This presentation is from the session 'Innovations in tax filing assistance', at the tax research symposium hosted by Prosper Canada and Intuit, February 7, 2019, in Ottawa.
Scaling tax filing assistance
In this presentation, John Silver, Executive Director, Community Financial Counselling Service (CFCS), Winnipeg, shares insights from the low income tax program at CFCS. This program files almost 10,000 returns each year, and also provides tax clinic support to other agencies and delivers detailed training for tax clinic volunteers. This presentation is from the session 'Innovations in tax filing assistance', at the tax research symposium hosted by Prosper Canada and Intuit, February 7, 2019, in Ottawa.
Get Your Piece of the Money Pie
In this presentation, Althea Arsenault, Manager of Resource Development, NB Economic and Social Inclusion Corporation, shares insights from the 'Get Your Piece of the Money Pie' tax clinic program. This program has operated since 2010, and currently files over 23,000 returns each year. This presentation is from the panel discussion 'National and regional strategies to boost tax filing', at the tax research symposium hosted by Prosper Canada and Intuit, February 7, 2019, in Ottawa.
Providing tax filing and benefits assistance to Indigenous communities
In this presentation, Simon Brascoupé, Vice President, Education and Training, AFOA Canada, explains the financial wellness framework and how tax filing presents opportunities for building financial wellness in Indigenous communities. This presentation is from the session 'Closing the tax-filing gap: Challenges and opportunities', at the tax research symposium hosted by Prosper Canada and Intuit, February 7, 2019, in Ottawa.
A Realist Analysis of Nonprofit Tax Filing Services
In this presentation, Kevin Schachter, Graduate Student at University of Manitoba and Information Manager at SEED Winnipeg, presents a realist analysis of nonprofit tax filing services. This presentation is from the session 'Closing the tax-filing gap: Challenges and opportunities', at the tax research symposium hosted by Prosper Canada and Intuit, February 7, 2019, in Ottawa.
Supporting Organizations in the CVITP
In this presentation, Aaron Kozak, ESDC and Melissa Valencia, CRA, present findings from their research on the Community Volunteer Income Tax Program (CVITP). This includes recommendations for structural changes to the program, review of CVITP training, changes to registration, and more. This presentation is from the session 'Closing the tax-filing gap: Challenges and opportunities', at the tax research symposium hosted by Prosper Canada and Intuit, February 7, 2019, in Ottawa.
The Community Volunteer Income Tax Program (CVITP)
In this presentation, Nancy McKenna, Manager, CVITP, Canada Revenue Agency, explains how the Community Volunteer Income Tax Program (CVITP) works. This includes eligibility requirements, the size of the program in 2017/2018, and partnerships. This presentation is from the session 'Closing the tax-filing gap: Challenges and opportunities', at the tax research symposium hosted by Prosper Canada and Intuit, February 7, 2019, in Ottawa.
Stories from the field: Contextualizing the barriers Indigenous People face
In this presentation, Erin Jeffery, Outreach Officer with Canada Revenue Agency (CRA) shares what the CRA Outreach team has learned about tax filing barriers facing Indigeous People in Canada. These barriers include lack of documentation, lack of trust, access to services, and challenges around accessing Canada Child Benefit. This presentation is from the session 'Barriers to tax filing experienced by people with low incomes', at the research symposium hosted by Prosper Canada and Intuit, February 7, 2019, in Ottawa.
Tax time insights: Experiences of people living on low income in Canada
In this presentation, Nirupa Varatharasan, Research & Evaluation Officer with Prosper Canada, explains the research methods and insights gathered in the report 'Tax time insights: Experiences of people living on low income in Canada.' This includes demographic information, the type of tax filing resources accessed by this population, and insights on the types of challenges and opportunities that result from their tax filing processes. This presentation is from the session 'Barriers to tax filing experienced by people with low incomes', at the research symposium hosted by Prosper Canada and Intuit, February 7, 2019, in Ottawa.
Income tax filing and benefits take-up: Challenges and opportunities for Canadians living on low incomes
In this presentation, Uttam Bajwa, Global Health and Research Associate with the Dalla Lana School of Public Health, University of Toronto, reports on tax filing challenges and opportunities for Canadians living on low incomes. This includes the challenges of not knowing what to do, fear and mistrust, and challenges accessing supports. This presentation is based on the research conducted for the Prosper Canada report 'Tax time insights: Experiences of people living on low incomes in Canada'. This presentation is from the session 'Barriers to tax filing experienced by people with low incomes', at the research symposium hosted by Prosper Canada and Intuit, February 7, 2019, in Ottawa.
Account Comparison Tool
Compare features for different chequing and savings accounts, including interest rates, monthly fees and transactions. Find an account that best suits your needs. Narrow your search, view search results, and compare your results using this account comparison tool from the Financial Consumer Agency of Canada.
English
Download in English
French
TFSA Calculator
This calculator will help you estimate the value of the investments in your TFSA when you’re ready to withdraw them, and compare this amount to the value of your investments in a non-registered plan to see your overall estimated tax savings.
The Perils of Living Paycheque to Paycheque
This report, 'The Perils of Living Paycheque to Paycheque: The relationship between income volatility and financial insecurity', examines the relationship between income instability and broader measures of financial well-being. This study makes use of a unique dataset that collected self-reported month-to-month volatility in household income, measures of capability, financial knowledge and psychological variables. One in three adult Canadians reported at least some volatility in their monthly incomes, with six per cent reporting that the source and amount were both uncertain. Income volatility is present across a wide swath of the survey respondents, regardless of gender, family status, region of the country, education level and even income sources. Income volatility is correlated with lower financial knowledge, lower financial capability, and stronger beliefs that financial outcomes are up to fate and outside of personal control.
English
2023 Tax Resources: Canada Revenue Agency
The Canada Revenue Agency kicks off the 2023 Tax filing season
- Factsheet – Students
- Factsheet – Persons with disabilities
- Factsheet – Modest income individuals
- Factsheet – Housing insecure individuals
- Factsheet – Adults 65 and older
- Factsheet – Indigenous peoples
- Factsheet: Northern residents deductions
- Factsheet: Individuals experiencing gender based violence
- Factsheet – Newcomers
Resources
- Infographic: Child-related benefits
- Infographic: Newcomers
- Tear sheet: Register for my account
- Tear sheet: Doing your taxes
- Service option card
- Video: Individuals with a modest income
- Video: Persons with disabilities
- Video: International Students
- Video: Students, it pays to do your taxes!
- SimpleFile by Phone automated phone service (formerly called File my Return)
2022 Tax Resources: Canada Revenue Agency
- Benefits and credits fact sheet – Students
- Benefits and credits fact sheet – Persons with disabilities
- Benefits and credits fact sheet – Modest income individuals
- Benefits and credits fact sheet – Housing insecure individuals
- Benefits and credits fact sheet – Adults 65 and older
- Benefits and credits fact sheet – Women in shelters
- Benefits and credits fact sheet – Indigenous peoples
- Benefits and credits fact sheet – Newcomers
Canada Dental Benefit
One-time top-up to the Canada Housing Benefit
Get your taxes done for free at a tax clinic
Canada workers benefit
Make sure you maximize the benefits you are entitled to if you are First Nations, Inuit, or Métis
2021 Tax Resources - Canada Revenue Agency
Last-minute tax tips (Canada Revenue Agency) – April 13, 2021
New Canada Recovery Benefits – What to Expect
Answers to your questions on paying back the Canada Emergency Response Benefit (CERB)
Benefits and credits fact sheet – Indigenous people living in Canada
Benefits and credits fact sheet – Modest income
Benefits and credits fact sheet – Newcomers
Benefits and credits fact sheet – Newcomers in Quebec
Benefits, credits, and deductions for Seniors
COVID-19 Measures for Persons with Disabilities
Benefits and credits – Persons with Disabilities
Canada Workers Benefit – Infographic
Canada Workers Benefit – promotion card
Get your taxes done for free – promotion card
Income tax basics
Why file? The benefits of tax filing (Tax toolkit)
Getting government payments by direct deposit
Income tax 101: What are tax deductions, benefits, credits, exemptions, and brackets? (Tax toolkit)
Considerations for Indigenous people at tax time (Tax toolkit)
Resources about tax filing in Canada (Tax toolkit)
Common tax deductions
Common sources of income and their tax slips
Notice of Assessment – how to read it
Community tax clinic guides
About volunteer tax clinics: Help your community members file their taxes (Tax toolkit)
Getting started as a community tax clinic (Tax toolkit)
Tax clinic staff and volunteer roles (Tax toolkit)
Tax clinic preparation: Recommended timeline (Tax toolkit)
Insights on planning free tax clinics in Indigenous communities: Infographic (Tax toolkit)
Encouraging tax filing at virtual clinics (sample “active choice” email) – The Behavioural Insights Team *NEW*
Tax clinic resources for practitioners
The tax clinic resources below are from our community partner organizations. These are examples that may be adapted to your own community tax clinic needs. Whenever possible, we have credited the original author of each document and included contact information if you would like to find out more about using and adapting the resource.
Resources to support tax clinic delivery and tax filing
Simplified Intake Form 2019 (ACSA, Scarborough, ON)
Tax Clinic Host Checklist (The Working Centre, Kitchener-Waterloo, ON)
Income tax checklist for participants (The Working Centre, Kitchener-Waterloo, ON)
Intake form for Couples (E4C, Edmonton, AB)
Tax Prep Quick Reference Guide (E4C, Edmonton, AB)
Other resources to support participants at tax time
Income tax summary (The Working Centre, Kitchener-Waterloo, ON)
Form for Missing Income Info for Revenue Canada (The Working Centre, Kitchener-Waterloo, ON)
Forms for rental information (The Working Centre, Kitchener-Waterloo, ON)
Referral to FEPS (The Working Centre, Kitchener-Waterloo, ON)
Envelope checklist (E4C, Edmonton, AB)
Seniors Info Sheet – Federal and provincial benefits (E4C, Edmonton, AB)
Resources for outreach and promotion
Tax clinic flyer (ACSA, Scarborough, ON)
2019 tax clinic flyer (Jane Finch Centre, Toronto, ON)
2019 tax clinic flyer (North York Community House, Toronto, ON)
Resources to support tracking and evaluation
Tax data entry sheet – Tax toolkit (Sunrise Community Centre, Calgary, AB)
Anonymous tax tracking sheet (Aspire collective, Calgary, AB)
Additional information and resources on tax filing
Benefits, credits and financial support: CRA and COVID-19 – Canada Revenue Agency (CRA)
Covid-19: Free virtual tax clinics – Canada Revenue Agency (CRA)
Get ready to do your taxes – Canada Revenue Agency (CRA)
Taking care of your tax and benefit affairs can pay off (tax filing info sheet) – Canada Revenue Agency (CRA) *NEW
Slam the scam – Protect yourself against fraud – Canada Revenue Agency (CRA)
Supported Self: File Piloting a new way to empower individuals to file taxes independently – Prosper Canada
Virtual Tax Filing: Piloting a new way to file taxes for homebound seniors – Prosper Canada
Webinar Series on Taxes (May 2020) – Momentum
SimpleFile by Phone automated phone service (formerly called File my Return) – Prosper Canada Learning Hub
Tax season prep – Plan Institute
Demystifying the Disability Tax Credit – Canada Revenue Agency (CRA)
What to do if your tax return is reviewed or audited – OSC
French
Ressources de déclaration de revenus 2023 - Agence du revenu du Canada
L’Agence du revenu du Canada lance la saison des impôts 2023
- Fiche descriptive: Étudiants
- Fiche descriptive: Les personnes handicapées
- Fiche descriptive: Les personnes à revenu modeste
- Fiche descriptive: Les personnes en situation de logement précaire
- Fiche descriptive: Les personnes âgées de 65 ans et plus
- Fiche descriptive: Les personnes autochtones
- Fiche descriptive : Déductions pour les habitants de régions éloignées
- Fiche descriptive : Personnes aux prises avec la violence fondée sur le sexe
- Fiche descriptive: Les nouveaux arrivants
Ressources
- Infographie – Prestations pour enfants
- Infographie – Prestations et crédits pour les nouveaux arrivants
- Feuille détachable : Inscrivez-vous à Mon dossier
- Feuille détachable : Produire votre déclaration de revenus
- Carte d’option de service
- Webinaire – Les personnes à revenu modeste
- Video: Persons with disabilities
- Webinaire – Les étudiants étrangers
- Webinaire – Avis aux étudiants : c’est payant de faire vos impôts!
Ressources de déclaration de revenus 2022 - Agence du revenu du Canada
Fiche descriptive : Étudiants
Fiche descriptive : Les personnes handicapées
Fiche descriptive : Les personnes à revenu modeste
Fiche descriptive : Les personnes en situation de logement précaire
Fiche descriptive : Les personnes âgées de 65 ans et plus
Fiche descriptive : Femmes dans les refuges
Fiche descriptive : Les personnes autochtones
Fiche descriptive : Les nouveaux arrivants
Prestation dentaire canadienne
Supplément unique à l’Allocation canadienne pour le logement
Faites faire vos impôts à un comptoir d’impôts gratuit
Allocation canadienne pour les travailleurs
Assurez-vous de maximiser les prestations auxquelles vous avez droit si vous êtes Autochtone, Inuit ou Métis
Ressources de déclaration de revenus 2021 - Agence du revenu du Canada
Nouvelles prestations canadiennes de la relance économique – À quoi s’attendre
Réponses à vos questions sur le remboursement de la Prestation canadienne d’urgence (PCU)
Recevez vos versements de prestations et de crédits! – Les les autochtones qui habitent au Canada
Prestations et crédits – Revenu modeste
Nouveaux arrivants, vous pourriez recevoir des prestations et des crédits!
Nouveaux arrivants, vous pourriez recevoir des prestations et des crédits! (Quebec)
Il y a des avantages à faire ses impôts! – Personnes agées
Mesures relatives à la COVID-19 à l’intention des personnes handicapées
Des prestations et des crédits pour vous! – Les personnes handicapées
Chaque dollar compte! – L’allocation canadienne pour les travailleurs (ACT)
Chaque dollar compte! Carte promotionnelle pour l’allocation canadienne pour les travailleurs (ACT)
Faites faire vos impôts gratuitement – Carte promotionnelle
Fondements de l’impôt sur le revenu
Pouruoi declarer? Les avantages de produire une declaration de revenus
Recevoir des paiements du gouvernement par dépôt direct
Que sont les déductions, les avantages fiscaux et les crédits d’impôt?
Considérations sur la période d’impôt pour lesautochtones qui habitent au Canada
Ressources pour en savoir plus
Comptoirs d’impôt bénévoles : Aidez les membres de votre communauté
Ressources
S’occuper de ses impôts et de ses prestations peut être payant – Agence du revenu du Canada
Service automatisé Déclarer simplement par téléphone (anciennement Produire ma déclaration)– Agence du revenu du Canada
Démystifier le crédit d’impôt pour personnes handicapées – Agence du revenu du Canada
Tout Bien Calcule
Pour souligner leurs 50 ans d’histoire, les Associations de consommateurs du Québec s’unissent pour offrir à la population québécoise un portail qui rassemble toute une gamme d’informations et d’outils développés au fil des années grâce à leur expertise en finances personnelles. Cette porte d’entrée donne accès à des services spécialisés en finances personnelles offerts par les associations, propose des outils adaptés, et à travers les différentes sections, offre une information claire, objective et critique afin de vous guider vers de meilleurs choix de consommation et une meilleure santé financière.
Indigenous Financial Literacy – AFOA 2014 Conference panel
This is the video recording of the AFOA 2014 Conference panel on Indigenous Financial Literacy. In this session, Liz Mulholland, Dr. Paulette Tremblay, Simon Brascoupe, and Darren Googoo discuss Indigneous financial wellness, financial literacy, and community education.
State of Cities Reducing Poverty
How has the Vibrant Communities – Cities Reducing Poverty (VC – CRP) network contributed to poverty reduction in Canada? In seeking to answer this central question, the State of Cities Reducing Poverty paper highlights the network’s numerous and varied impacts.
National Investor Research Study
This presentation shows the results of a quantitative study undertaken by the Ontario Securities Commission to assess attitudes, behaviour and knowledge among Canadians pertaining to a variety of investment topics. These topics include retirement planning and conversations about finances.
Debt and Consumer Rights: Credit repair
This educational brief from CLEO explains what a credit report is, and what to do if you want to fix your credit report or work with a credit repair agency.
2018 Report Card on Child and Family Poverty in Canada: Bold Ambitions for Child and Family Poverty Eradication
The 2018 national report card “Bold Ambitions for Child Poverty Eradication in Canada,” provides a current snapshot of child and family poverty and demonstrates the need for a costed implementation plan to eradicate child poverty in this generation. In advance of the 30th year of the all-party commitment to eliminate child poverty by the year 2000 and the federal election in 2019, our spotlight is on the central role of universal childcare in the eradication of child poverty. The lack of affordable, high quality childcare robs children of valuable learning environments and keeps parents, mainly women, out of the workforce, education and training. Without childcare, parents cannot lift themselves out of poverty and improve their living standards.
Resources
Handouts, slides, and time-stamps
Presentation slides for this webinar
Handouts for this webinar:
RESP case plan – webinar handout (from Credit Counselling Sault Ste. Marie)
RESP tracking sheet – webinar handout (from Credit Counselling Sault Ste. Marie)
RESP quick reference sheet – webinar handout (from FSGV)
RESP sample letter to schools – webinar handout (from Credit Counselling Sault Ste. Marie)
Time-stamps for the video recording:
3:00 – Agenda and introductions
5:05 – Audience polls
9:00 – Importance of education savings (Speaker: Glenna Harris)
16:00 – Credit Counselling Services Sault Ste. Marie and District (Speaker: Allyson Schmidt)
33:00 – Family Services of Greater Vancouver (Speaker: Rocio Vasquez)
54:45 – Q&A
What does poverty look like in Canada? Survey finds one-in-four experience notable economic hardship
What does it mean to be poor in Canada? Does it mean having to rely on food banks and payday loans to make ends meet? Does it mean struggling to afford warm clothes for the winter? What about having to live far away from work or school? A new, two-part study from the Angus Reid Institute examines the state of poverty in Canada by looking at lived experiences, rather than income, with some striking results.
The Little Black Book of Scams (2nd edition)
Scammers are sneaky and sly. They can target anyone, from youngsters to retirees. They can also target businesses. No one is immune to fraud. Read this booklet to find out how you can also become a fraud-fighting superhero. Share this booklet with family and friends and start powering up!
Our group of superheroes has found a way to see through the scams. Their secret is simple: knowledge is power!
Improving Education Outcomes through Children’s Education Savings
Children’s education savings accounts are a vital tool in boosting high school completion rates, increasing post-secondary education attainment, and reducing poverty. Research shows that saving for a child’s education is connected to improved child development, greater educational and career expectations, and future financial capability. This brief explains why RESPs are so important, and how parents can use RESPs to save for their children's education.
Cross Canada Check-up: Provincial/territorial findings from Canada’s Neighbourhood Financial Health Index
Canada ranks consistently as one of the best places to live in the world and one of the wealthiest. When it comes to looking at the financial health of Canadian households, however, we are often forced to rely on incomplete measures, like income alone, or aggregate national statistics that tell us little about the distribution of financial health and vulnerability in our neighbourhoods, communities or provinces/territories. The purpose of this report is to examine the financial heath and vulnerability of Canadian households in different provinces and territories using a new composite index of household financial health, the Neighbourhood Financial Health Index or NFHI. The NFHI has been designed to shine a light on the dynamics underlying these national trends, taking a closer look at what is happening at the provincial/territorial, community and neighbourhood levels. Update July 22, 2022: Please note that the Neighbourhood Financial Health Index is no longer available
Insights on planning free tax clinics in Indigenous communities
This infographic by Prosper Canada features advice to help Indigenous communities and organizations set up free income tax clinics. Advice was shared by clinic volunteers through a roundtable and interviews as part of the First Nations Financial Wellness project.
Complaints Related to Service from the CRA: Lessons Learned and Working Towards Better Service
Operating at arm’s length from the Canada Revenue Agency, the Office of the Taxpayers' Ombudsman (OTO) works to enhance the Canada Revenue Agency's (CRA) accountability in its service to, and treatment of, taxpayers through independent and impartial reviews of service-related complaints and systemic issues. OTO receives complaints and concerns from members of First Nations, Inuit and Métis communities. In this conference presentation, the Taxpayers’ Ombudsman provides examples of the types of issues her Office receives in order to provide community leaders with her insights in helping Indigenous people get better service from the CRA. In support of the AFOA Canada 2018 National Conference theme of Human Capital – Balancing Indigenous Culture and Creativity with Modern Workplaces, this presentation will provide participants with information on the types of issues and trends her office sees from members of the Indigenous communities and on better ways of serving these populations.
Financial Literacy of Indigenous Secondary Students in the Atlantic Provinces
Research conducted by agencies such as AFOA, Native Women’s Association of Canada, and various other Canadian entities, has identified the need for improved financial literacy education in Indigenous communities, particularly among youth and Elders. Such research reports are often equipped with a list of recommendations for improving and addressing the gaps in education around financial literacy. In the spirit of building upon this research into financial literacy and Indigenous peoples, the Purdy Crawford Chair in Aboriginal Business Studies (PCC) proposed a project focused on Atlantic Canada’s 14-18 year old Indigenous population and their levels of financial literacy. The results reveal that the majority of respondents would like to learn more about money. As well, they affirm that face-to-face learning from family members and in classroom settings remain the preferred way to learn about financial issues. Finally, based on the literature review, the environmental scan, survey data, and feedback from the community consultation process, a web application titled Seven Generations Financial Literacy was developed and is located at www.sevengenerationsfinancial.com.
Increasing Take-Up of the Canada Learning Bond
The Canada Learning Bond (CLB) is an educational savings incentive that provides children from low income families born in 2004 or later with financial support for post-secondary education. Personal contributions are not required to receive the CLB, however take-up remains low among the eligible population. The Impact and Innovation Unit (IIU), in collaboration with the Learning Branch and the Innovation Lab at Employment and Social Development Canada (ESDC) conducted a randomized controlled trial to test the effectiveness of behavioural insights (BI) in correspondence sent to primary caregivers of children eligible for the CLB. This trial demonstrates the effectiveness of BI interventions tailored to the particular behavioural barriers that affect specific populations in increasing take-up of programs like the CLB. If scaled across the eligible population, the best performing letter would result in thousands more children receiving this education savings incentive on an annual basis.
Summary Brief: High-Cost Alternative Financial Services
Many Albertans turn to high-cost alternative financial services when they need a short-term fix for a financial issue. Though these services are expensive and unsafe, they are often the only option for low-income individuals, particularly those who struggle to obtain credit at mainstream financial institutions. High-cost alternative financial services contribute to a two-tiered banking system, in which the poor often pay more for inferior services. Without more stringent regulation, and in the absence of safe and affordable short-term credit options, Albertans living on lower-incomes will continue to experience financial exclusion and take on heavy debt loads – both of which are major contributors to long-term poverty.
High-Cost Alternative Financial Services: Policy Options
Many Canadians turn to high-cost alternative financial services when they need a short-term fix for a budgetary issue. Though these banking and credit alternatives are a convenient choice for individuals in search of fast cash, particularly those who face barriers to obtaining credit at a bank or credit union, access comes at a steep price and with a high degree of risk. On its own, one high-cost loan has the potential to trap a borrower in a cycle of debt, not only amplifying their short-term problem, but also limiting their ability to secure the income and assets needed to thrive in the long term. The policy recommendations presented in this brief, and summarized in the chart on page two, are inspired by the regulatory initiatives across the country, and reflect ways in which all three levels of government can contribute to better consumer protection for all Canadians.
The Canada Learning Bond: What you need to know
This one-page fact sheet tells you everything you need to know to make your child's future possibilities grow! The Canada Learning Bond (CLB) is a grant of $500 up to $2000 from the Government of Canada to eligible families to help with the cost of a child’s education after high school. It is deposited directly into a child’s Registered Education Savings Plan (RESP). Children born January 1, 2004 or later, whose family’s annual income is less than $46,000 can receive the CLB.
The Omega Foundation and the SmartSAVER Program, Lessons in Taking Social Innovations to Scale
This case study is about the Omega Foundation’s SmartSAVER program. It has effectively elevated the Canada Learning Bond (a post-secondary education savings program for low income families) from a struggling idea to a fully-fledged and well-utilized national resource. In so doing, Omega and SmartSAVER have created new pathways out of poverty for thousands of Canadians. This story gives us significant insight into the process of bringing an innovative idea to life. It offers important observations about the barriers to launching and scaling innovative ideas. It also offers insights into the solutions that can overcome these barriers.
Strengthening retirement security for low- and moderate-income workers
In this video presentation Johnathan Weisstub from Common Wealth discusses recent improvements in senior Canadians' poverty levels due to benefits such as OAS and GIS, and the challenges that still remain in ensuring retirement security for modest-earning and low-income Canadians. This presentation was given at the Prosper Canada Policy Research Symposium on March 9, 2018. Read the slide deck that accompanies this presentation. View the full video playlist of all presentations from this symposium.
Breaking down barriers: A critical analysis of the Disability Tax Credit and the Registered Disability Savings Plan
The Disability Tax Credit helps Canadians by reducing the amount of income tax they are required to pay. The Registered Disability Savings Plan helps people with a disability or their caregiver save for the future by putting money into a fund that grows tax free until the beneficiary makes a withdrawal. This report, released by the Senate Committee on Social Affairs, Science and Technology, makes 16 recommendations aimed at improving both programs. They are divided into short-term objective to make the process for the two programs simpler and clearer, and a long-term philosophical shift in the way Canada deals with people who are in financial distress but cannot advocate for themselves. Recommendations include removing barriers that prevent people from taking advantage of the Disability Tax Credit and making enrolment in the Registered Disability Savings Plan automatic for eligible people under 60 years of age.
Redesigning Social Policy for the 21st Century
In this video presentation Sunil Johal from the Mowat Centre explains how social policy in the 21st century could be redesigned to accommodate the changing nature of work and income in Canada. This presentation was given at the Prosper Canada Policy Research Symposium on March 9, 2018. Read the slide deck that accompanies this presentation. Pour lire les diapositives de la présentation, cliquez ici. View the full video playlist of all presentations from this symposium.
Do we have the data we need to tackle household financial instability?
In this presentation Catherine Van Rompaey of Statistics Canada examines the data we have available to measure financial instability in Canada - household debt, savings, and credit. This presentation was given at the Prosper Canada Policy Research Symposium on March 9, 2018. Read the slide deck that accompanies this presentation. Pour lire les diapositives de la présentation, cliquez ici. View the full video playlist of all presentations from this symposium.
Group RESP Educational Materials
This document explains the basics of group RESPs, including what they are, what they may cost, what you need to know about your group RESP if you are already enrolled in a plan, and how to figure out your options. Read more about the research behind these materials here.
The Regulation of Group Plan RESPs and the Experiences of Low-Income Subscribers
Through the Group RESP Research and Education Project, SEED Winnipeg, Momentum (Calgary), the Legal Help Centre of Winnipeg, and an interdisciplinary research team studied the regulation of group plan RESPs and the experiences of low-income subscribers, and developed public legal education materials to support low-income RESP subscribers in understanding and making informed decisions about their RESP investments. This report presents the research component of this project. This report shows that group plan RESPs are complex, and while they can be beneficial, participation in a group plan may be detrimental to a subscriber's financial well-being if the plan is not well aligned with the subscriber's needs. Low-income subscribers continue to be significantly represented in RESPs held by group plan promoters.
Neighbourhood Financial Health Index: Making the Invisible Visible
In this video presentation Katherine Scott from the Canadian Council on Social Development (CCSD) shares the new Neighbourhood Financial Health Index, a mapping tool which uses composite data about income, assets, debt, and poverty to show levels of financial health at the neighbourhood scale. This presentation was given at the Prosper Canada Policy Research Symposium on March 9, 2018. Read the slide deck that accompanies this presentation. Pour lire les diapositives de la présentation, cliquez ici. View the full video playlist of all presentations from this symposium. Update July 22, 2022: Please note that the Neighbourhood Financial Health Index is no longer available
Income and Expense Volatility Survey Results
In this video presentation Patrick Ens from Capital One explains the impact of income and expense volatility on consumers. Capital One found that half of Canadian households surveyed experience some amount of income fluctuation month to month. This impacts their ability to save, cope with emergencies, and other aspects of their lives. This presentation was given at the Prosper Canada Policy Research Symposium on March 9, 2018. Read the slide deck that accompanies this presentation. Pour lire les diapositives de la présentation, cliquez ici. View the full video playlist of all presentations from this symposium.
Canada’s household balance sheets
In this video presentation Andrew Heisz from Statistics Canada explains the changing household assets, debt, and income levels of Canadians of different age generations. This presentation was given at the Prosper Canada Policy Research Symposium on March 9, 2018. Read the slide deck that accompanies this presentation. View the full video playlist of all presentations from this symposium.
Debt and High Interest Resource Portal
This is ACORN Canada's debt and high-interest lending resource portal. It contains links and resources on debt, credit, banking, and other topics.
The Complaints Process for Retail Investments in Canada: A Handbook for Investors
Canadian investors need more and better information to protect themselves both when they act on their own and when they retain lawyers. This handbook is intended to help Canadian investors better understand the choices they face when making a complaint and the impact of those choices. It can also serve as a guide to assist them when they work with lawyers, particularly those whose law practice does not focus on assisting Canadian investors in obtaining financial compensation.
Financial Coaching Process Evaluation Report
This report presents the findings of the process evaluation of the Financial Coaching pilot, a part of the Financial Empowerment Collaborative in Calgary. In documenting the procedures and early thoughts of participating programs on the implementation of this pilot project, we assessed how well early goals are being met, documented some promising best practices, identified common roadblocks encountered by agencies, and compiled solutions developed in response to those roadblocks.
Canada Islamic Finance Outlook 2016
Islamic finance is growing rapidly, outpacing the growth of the conventional finance industry and even grabbing market share from it. This success has been driven in part by the internationalisation of Islamic finance as it reaches beyond its core markets of the Middle East, North Africa and Southeast Asia, and into new ones such as Europe and the Americas, including Canada, which is the focus of this report.
This report provides an introduction to Islamic banking in Canada.
Enhancing access to the Canada Learning Bond
This discussion paper responds to a request from ESDC to develop options for reforms to the Canada Education Savings Program and, more specifically to improve access to the Canada Learning Bond. It reviews individual and institutional challenges to participation in the current system and consider three approaches for reform. It presents a case study of the United Kingdom’s Child Trust Fund, which included an auto-enrolment default mechanism. It concludes that the model used in the UK is not suitable for Canada and instead make a series of recommendations for both incremental and more ambitious reforms to fulfill the Government’s commitment to improve access to the Bond.
Unfinished Business Pension Reform in Canada
Since taking office in the fall of 2015, the Liberal government has made important changes to the publicly administered components of Canada’s retirement income system (RIS). It has restored the age of eligibility for benefits under Old Age Security (OAS) and the Guaranteed Income Supplement (GIS) to 65, it has increased the top-up on GIS benefits for single elderly persons, and it has agreed with the provinces to enhance Canada Pension Plan (CPP) benefits, starting in 2019.
Each of these changes, on its own, contributes to one of the two main objectives of the RIS: to minimize the people’s risk of poverty in old age and to enhance their ability to retain their standard of living as they move from employment to retirement. However, as Bob Baldwin and Richard Shillington show in this study, when examined together, the changes are problematic and incomplete.
SmartSAVER: Canada Learning Bond Infographic
An infographic highlighting how to attend post-secondary education with no student debt. It shows how a family eligible for the Canada Learning Bond, with average family savings, student earnings and available grants can cover the cost of post-secondary education (PSE) with no need to borrow.
Backgrounder: Working Income Tax Benefit
The federal government has indicated that it will expand WITB by approximately $250 million per year beginning in 2019 to “provide additional benefits that roughly offset incremental Canada Pension Plan (CPP) contributions for eligible low-income workers.”1 The changes to CPP will be phased in, starting in 2019. These changes mean that workers will be paying higher CPP contributions from their paycheques. Low-income workers especially could feel the impact on their take-home pay. This backgrounder provides an introduction to the program, explores how it impacts low-income workers, and how it could be improved.
Using Design to Deepen Relationships in the Financial Sector
This publication reveals the outcomes of Bridgable's work with a federal credit union, cutting through their overwhelming number of offerings to better engage with their low-income members. It also discusses why agility is a better bet than digitization when it comes to our changing financial ecosystem. Finally, it will break down their approach to one of the most popular design methods today, the design sprint, and how it can produce results while also lowering risk. Note: This link will allow you to download the document from the Bridgeable website.
MPower Money Coaching Program
This is the final report on the MPower Money Coaching Program. This program was a unique collaboration that brought together Prosper Canada, a national charity, Canada’s leading investment firms and investment industry associations, and the City of Toronto’s Employment and Social Services Division (TESS) to provide neutral, high quality financial help to people living on low incomes.
Handout 9-12: Consumerism resources
This is the resources handout for Module 9: Consumerism, from the Prosper Canada Financial Literacy Facilitator Resources. To view full Financial Literacy Facilitator Resources, click here.
Child Welfare and Youth Homelessness in Canada: A Proposal for Action
Responses to and Repercussions from Income Volatility in Low- and Moderate-Income Households: Results from a National Survey
What to do when you get an income tax refund
Policy Brief – Why is Uptake of the Disability Tax Credit Low in Canada?
Disability supports should be designed to provide benefit and not burdens to eligible recipients. Unfortunately, this is not a reality when it comes to one of the main benefits open to Canadians with disability: the federal Disability Tax Credit (DTC). Designed to recognize some of the higher costs faced by people with severe disabilities and their caregivers, the DTC appears to be more of a burden for many, with estimated utilisation unacceptably low at around 40 per cent of working-aged adults with qualifying disabilities. Low uptake is a concern not only because people are missing out on the credit itself but also because eligibility to the DTC – which is not automatic – is a gateway to other important and more valuable benefits such as the Child Disability Benefit and Registered Disability Savings Plans (RDSP).
Managing your money: Tools and tips to help you meet your goals (English)
MYM Worksheet 1: Your money goals
MYM Worksheet 1: Your money goals – Fillable PDF
MYM Worksheet 2: Tracking your regular income
MYM Worksheet 2: Tracking your regular income – Fillable PDF
MYM Worksheet 3: Tracking your spending
MYM Worksheet 3: Tracking your spending – Fillable PDF
MYM Worksheet 4: Tracking your bills
MYM Worksheet 4: Tracking your bills – Fillable PDF
MYM Worksheet 5: Monthly budgeting
MYM Worksheet 5: Monthly budgeting – Fillable PDF
MYM Worksheet 6: Setting a savings goal
MYM Worksheet 6: Setting a savings goal – Fillable PDF
MYM Worksheet 7: Preparing for tax filing
MYM Worksheet 7: Preparing for tax filing
About the ‘Managing your money’ resource
All ‘Managing your money’ worksheets
Facilitator resources (English)
Gérer votre argent: Outils et conseils pour vous aider à atteindre vos objectifs (French)
Feuille de travail #1: Vos objectifs en lien à l’argent (MYM)
Feuille de travail #2: Suivi de votre revenu régulier (MYM)
Feuille de travail #3: Suivi de vos dépenses (MYM)
Feuille de travail #4: Suivi de vos factures (MYM)
Feuille de travail #5: Budget mensuel (MYM)
Feuille de travail #6: Fixer un objectif d’épargne (MYM)
Feuille de travail #7: Préparation pour la déclaration de revenus (MYM)
Note pour les communautés et les organismes (MYM)
Feuilles de travail complètes
Ka-paminit kisôniyâm (Plains Cree)
Handout 9-13: Consumerism glossary
This handout is from Module 9 of the Financial Literacy Facilitator Resources. Glossary of terms relating to consumerism. To view full Financial Literacy Facilitator Resources, click here.
Handout 9-8: Dealing with consumer problems
This handout is from Module 9 of the Financial Literacy Facilitator Resources. Examples of how to deal with consumer problems. To view full Financial Literacy Facilitator Resources, click here.
Handout 9-7: Common frauds and scams
This handout is from Module 9 of the Financial Literacy Facilitator Resources. Common consumer frauds and scams to look out for. To view full Financial Literacy Facilitator Resources, click here.
Handout 9-5: Cell phone information
This handout is from Module 9 of the Financial Literacy Facilitator Resources. Information about cell phone plans and what is involved when you purchase one. To view full Financial Literacy Facilitator Resources, click here.
Handout 9-3: Smart shopping tips
This handout is from Module 9 of the Financial Literacy Facilitator Resources. Smart shopping tips. To view full Financial Literacy Facilitator Resources, click here.
Handout 9-2: Advertising techniques and sales tactics
This handout is from Module 9 of the Financial Literacy Facilitator Resources. Explanation of different advertising and sales techniques. To view full Financial Literacy Facilitator Resources, click here.
Activity sheet 9-11: Consumerism goal setting
This activity sheet is from Module 9 of the Financial Literacy Facilitator Resources. Setting goals related to consumerism. To view full Financial Literacy Facilitator Resources, click here.
Activity sheet 9-10: Rate your financial knowledge, part 2
This activity sheet is from Module 9 of the Financial Literacy Facilitator Resources. Use this quiz to rate your financial knowledge. To view full Financial Literacy Facilitator Resources, click here.
Activity sheet 9-9: Complaint letter
This activity sheet is from Module 9 of the Financial Literacy Facilitator Resources. A template for writing a consumer complaint letter. To view full Financial Literacy Facilitator Resources, click here.
Activity sheet 9-6: Cell phone checklist
This activity sheet is from Module 9 of the Financial Literacy Facilitator Resources. A checklist of questions to answer when you are getting a cell phone. To view full Financial Literacy Facilitator Resources, click here.
Activity sheet 9-4: Find the better deal
This activity sheet is from Module 9 of the Financial Literacy Facilitator Resources. Figure out which item is the better deal by calculating the unit cost. To view full Financial Literacy Facilitator Resources, click here.
Activity sheet 9-1: Consumer quiz
This activity sheet is from Module 9 of the Financial Literacy Facilitator Resources. What kind of consumer are you? Take the quiz. To view full Financial Literacy Facilitator Resources, click here.
Handout 8-10: Debt glossary
This handout is from Module 8 of the Financial Literacy Facilitator Resources. Glossary of terms about debt. To view full Financial Literacy Facilitator Resources, click here.
Handout 8-9: Debt resources
This handout is from Module 8 of the Financial Literacy Facilitator Resources. Web resources about debt in Canada. To view full Financial Literacy Facilitator Resources, click here.
Handout 8-6: Collection rules
This handout is from Module 8 of the Financial Literacy Facilitator Resources. Debt collection rights and what a collection agency has the right to do and not to do. To view full Financial Literacy Facilitator Resources, click here.
Handout 8-5: Dealing with creditors
This handout is from Module 8 of the Financial Literacy Facilitator Resources. Tips for dealing with creditors over the phone or by mail, or for creating a debt repayment plan. To view full Financial Literacy Facilitator Resources, click here.
Handout 8-4: Steps to debt repayment
This activity sheet is from Module 8 of the Financial Literacy Facilitator Resources. Steps for debt repayment. To view full Financial Literacy Facilitator Resources, click here.
Activity sheet 8-8: Goal setting
This activity sheet is from Module 8 of the Financial Literacy Facilitator Resources. Goal setting for debt. To view full Financial Literacy Facilitator Resources, click here.
Activity sheet 8-7: Debt collection role play
This activity sheet is from Module 8 of the Financial Literacy Facilitator Resources. Role play activity about debt collection. To view full Financial Literacy Facilitator Resources, click here.
Activity Sheet 8-3: Ladder of debt repayment options
This activity sheet is from Module 8 of the Financial Literacy Facilitator Resources. Print these pages and cut into individual ‘rungs’ for use in the activity. To view full Financial Literacy Facilitator Resources, click here.
Activity sheet 8-2: Debt do’s and don’ts
This activity sheet is from Module 8 of the Financial Literacy Facilitator Resources. Group activity to talk about debt do's and don'ts. To view full Financial Literacy Facilitator Resources, click here.
Activity sheet 8-1: How much is TOO much?
This activity sheet is from Module 8 of the Financial Literacy Facilitator Resources. How much debt is too much debt? Consider the 20/10 rule. To view full Financial Literacy Facilitator Resources, click here.
Handout 7-13: Credit reporting glossary
This handout is from Module 7 of the Financial Literacy Facilitator Resources. Glossary of terms for credit reporting. To view full Financial Literacy Facilitator Resources, click here.
Handout 7-12: Credit reporting resources
This handout is from Module 7 of the Financial Literacy Facilitator Resources. Web resources for credit reporting in Canada. To view full Financial Literacy Facilitator Resources, click here.
Handout 7-10: Ways to improve your credit score
This handout is from Module 7 of the Financial Literacy Facilitator Resources. Ways to improve your credit score. To view full Financial Literacy Facilitator Resources, click here.
Handout 7-8: Correcting common errors on credit reports
This handout is from Module 7 of the Financial Literacy Facilitator Resources. How to correct common errors on credit reports. To view full Financial Literacy Facilitator Resources, click here.
Handout 7-5: Credit scores
This handout is from Module 7 of the Financial Literacy Facilitator Resources. A credit score is a score between 300 and 900 that credit bureaus use to rate the information in your credit report. Credit bureaus use a mathematical formula based on many factors to arrive at your credit score. To view full Financial Literacy Facilitator Resources, click here.
Handout 7-4: Reading a credit report
This handout is from Module 7 of the Financial Literacy Facilitator Resources. The information in an Equifax credit report varies slightly from a TransUnion credit report, but both contain the same basic sections. To view full Financial Literacy Facilitator Resources, click here.
Handout 7-3: Sample Equifax credit report
This handout is from Module 7 of the Financial Literacy Facilitator Resources. A sample of a credit report received from Equifax. To view full Financial Literacy Facilitator Resources, click here.
Handout 7-2: Credit reports
This handout is from Module 7 of the Financial Literacy Facilitator Resources. Credit bureaus summarize your credit use in a report. The credit report is one of the main things lenders look at when they decide whether or not to give you credit. A credit report contains your history of credit use, and your credit ratings. To view full Financial Literacy Facilitator Resources, click here.
Handout 7-1: Credit bureaus
This handout is from Module 7 of the Financial Literacy Facilitator Resources. Credit bureaus are agencies that collect information about how we use credit. They produce personal credit reports. Credit bureaus are private companies. They are regulated by the province, but they are not part of the government. To view full Financial Literacy Facilitator Resources, click here.
Activity sheet 7-11: Goal setting and credit reports
This activity sheet is from Module 7 of the Financial Literacy Facilitator Resources. Practice setting goals related to credit reports. To view full Financial Literacy Facilitator Resources, click here.
Activity sheet 7-9: Credit score scenarios
This activity sheet is from Module 7 of the Financial Literacy Facilitator Resources. Credit score scenarios to practice learning. To view full Financial Literacy Facilitator Resources, click here.
Activity sheet 7-7: TransUnion sample request form
This activity sheet is from Module 7 of the Financial Literacy Facilitator Resources. A sample of the TransUnion request sheet to obtain a free credit report. To view full Financial Literacy Facilitator Resources, click here.
Activity sheet 7-6: Sample Equifax request sheet
This activity sheet is from Module 7 of the Financial Literacy Facilitator Resources. A sample of the Equifax request sheet to obtain a free credit report. To view full Financial Literacy Facilitator Resources, click here.
Handout 6-7: Credit glossary
This handout is from Module 6 of the Financial Literacy Facilitator Resources. Glossary of terms related to credit. To view full Financial Literacy Facilitator Resources, click here.
Handout 6-6: Credit resources
This handout is from Module 6 of the Financial Literacy Facilitator Resources. Web resources for credit and credit cards. To view full Financial Literacy Facilitator Resources, click here.
Handout 6-4: Managing credit
This handout is from Module 6 of the Financial Literacy Facilitator Resources. Tips for managing credit. To view full Financial Literacy Facilitator Resources, click here.
Handout 6-3: The cost of credit
This handout is from Module 6 of the Financial Literacy facilitator curriculum. The cost of credit for different payment methods.
Handout 6-2: Credit card features
This handout is from Module 6 of the Financial Literacy Facilitator Resources. The features of credit cards and what they mean. To view full Financial Literacy Facilitator Resources, click here.
Handout 6-1: Types of credit
This handout is from Module 6 of the Financial Literacy Facilitator Resources. The different types of credit and their lending conditions. To view full Financial Literacy Facilitator Resources, click here.
Activity sheet 6-5: Goal setting and credit
This activity sheet is from Module 6 of the Financial Literacy Facilitator Resources. Practice setting goals related to credit. To view full Financial Literacy Facilitator Resources, click here.
Handout 5-10: Saving resources
This handout is from Module 5 of the Financial Literacy Facilitator Resources. Website resource list for saving. To view full Financial Literacy Facilitator Resources, click here.
Handout 5-6: Savings tools (basic)
This handout is from Module 5 of the Financial Literacy facilitator curriculum. Basic description of savings accounts and financial products available in Canada. To view full Financial Literacy facilitator curriculum, click here.
Handout 5-11: Glossary for saving module
This handout is from Module 5 of the Financial Literacy Facilitator Resources. Glossary of savings terms. To view full Financial Literacy Facilitator Resources, click here.
Handout 5-7: Savings tools (detailed)
This handout is from Module 5 of the Financial Literacy Facilitator Resources. Explains details about different kinds of savings accounts and financial products typically available in Canada. To view fill Financial Literacy Facilitator Resources, click here.
Handout 5-4: Compound interest
This handout is from Module 5 of the Financial Literacy Facilitator Resources. Explains compound interest. To view full Financial Literacy Facilitator Resources, click here.
Activity sheet 5-9: Goal setting for saving
This activity sheet is from Module 5 of the Financial Literacy Facilitator Resources. Review the activities you did early in this session to help you get ideas about savings goals. Also, think about other goals you can set, like doing more research or making an appointment with a financial advisor. To view full Financial Literacy Facilitator Resources, click here.
Activity sheet 5-8: Savings tools quiz
This activity sheet is from Module 5 of the Financial Literacy Facilitator Resources. Savings tools quiz. To view full Financial Literacy Facilitator Resources, click here.
Activity sheet 5-3: Finding money
This activity sheet is from Module 5 of the Financial Literacy Facilitator Resources. Use this chart to list some of the things that you buy a lot. Note how often you buy them in a month. Put down how much they usually cost (“average price”). Then figure out how much you spend on them in a month. To view full Financial Literacy Facilitator Resources, click here.
Activity sheet 5-2: Needs and wants
This activity sheet is from Module 5 of the Financial Literacy Facilitator Resources. List some of the things you have spent money on in the last two weeks. Which items are needs and which are wants? To view full Financial Literacy Facilitator Resources, click here.
Activity sheet 5-1: Setting savings goals
This activity sheet is from Module 5 of the Financial Literacy Facilitator Resources. Steps to setting a savings goal. To view full Financial Literacy Facilitator Resources, click here.
Handout 4-12: Glossary for banking and financial services
This handout is from Module 4 of the Financial Literacy Facilitator Resources. Glossary for banking and financial services. To view full Financial Literacy Facilitator Resources, click here.
Handout 4-11: Banking and financial services resources
This handout is from Module 4 of the Financial Literacy Facilitator Resources. Resource list of websites about banking and financial services. To view full Financial Literacy Facilitator Resources, click here.
Handout 4-8: Alternative financial services
This handout is from Module 4 of the Financial Literacy Facilitator Resources. Alternative financial services are outside of the traditional, regulated banking system. They do not take deposits like a bank or credit union. To view full Financial Literacy Facilitator Resources, click here.
Handout 4-7: What are my rights?
This handout is from Module 4 of the Financial Literacy Facilitator Resources. What are your rights when opening a bank account in Canada? To view full Financial Literacy Facilitator Resources, click here.
Handout 4-6: Opening a bank account
This handout is from Module 4 of the Financial Literacy Facilitator Resources. How to open a bank account in Canada. To view full Financial Literacy Facilitator Resources, click here.
Handout 4-4: Bank accounts and services
This handout is from Module 4 of the Financial Literacy Facilitator Resources. The different kinds of bank accounts and services available. in Canada. To view full Financial Literacy Facilitator Resources, click here.
Handout 4-5: Choosing a bank and choosing an account
This handout is from Module 4 of the Financial Literacy Facilitator Resources. Choosing a bank and choosing an account based on your banking needs. To view full Financial Literacy Facilitator Resources, click here.
Handout 4-2: Deposit insurance at credit unions
This handout is from Module 4 of the Financial Literacy Facilitator Resources. Deposit insurance amounts from credit unions in different provinces. To view full Financial Literacy Facilitator Resource, click here.
Handout 4-1: Banks and credit unions
This handout is from Module 4 of the Financial Literacy Facilitator Resources. Banks and credit unions are places where you can safely deposit your money, cash your cheques, pay your bills, ask for a loan or credit card and use a variety of saving and investment tools. This chart explains the differences between banks and credit unions. To view full Financial Literacy Facilitator Resources, click here.
Activity sheet 4-9: Comparing alternative financial services to banking services
This activity sheet is from Module 4 of the Financial Literacy Facilitator Resources. Why use alternative financial services? Why use banking services? List the reasons for using the services that your group was assigned. To view full Financial Literacy Facilitator Resources, click here.
Activity sheet 4-3: Banks and banking services quiz
This activity sheet is from Module 4 of the Financial Literacy Facilitator Resources. Banks and banking services quiz: In pairs, match the items in column A to column B. To view full Financial Literacy Facilitator Resources, click here.
Handout 3-12: Budgeting glossary
This handout is from Module 3 of the Financial Literacy Facilitator Resources. Glossary of budgeting terms. To view full Financial Literacy Facilitator Resources, click here.
Handout 3-11: Resources – Money management websites
This activity sheet is from Module 3 of the Financial Literacy Facilitator Resources. Resource websites for money management. To view full Financial Literacy Facilitator Resources, click here.
Handout 3-9: Financial record keeping
This activity sheet is from Module 3 of the Financial Literacy Facilitator Resources. Here are some important papers and records. You should keep them in a safe place and organize them so that you can find what you need. The chart shows their “shelf life” – how long you should keep them. To view full Financial Literacy Facilitator Resources, click here.
Handout 3-8: Budgeting tips
This activity sheet is from Module 3 of the Financial Literacy Facilitator Resources. Different types of budgeting tips to help you stay on track. To view full Financial Literacy Facilitator Resources, click here.
Activity sheet 3-10: Goal setting
This activity sheet is from Module 3 of the Financial Literacy Facilitator Resources. Take a few minutes to reflect on how this workshop relates to your life. Set one or two SMART goals for your personal budgeting and financial record-keeping. To view full Financial Literacy Facilitator Resources, click here.
Activity sheet 3-6: Making your own budget
This activity sheet is from Module 3 of the Financial Literacy facilitator curriculum. Steps involved in making your own budget. To view full Financial Literacy Facilitator Resources, click here
Activity sheet 3-4: Budgeting scenarios
This activity sheet is from Module 3 of the Financial Literacy facilitator curriculum. Using the Monthly Budget Worksheet, put together a budget for the person in your scenario. Feel free to make up more details. You can also change or add categories to the budget to match your person’s situation. To view full Financial Literacy Facilitator Resources, click here.
Activity sheet 3-3: Budgeting expense categories
This activity sheet is from Module 3 of the Financial Literacy Facilitator Resources. Tracking your different categories of expenses. To view full Financial Literacy Facilitator Resources, click here.
Activity sheet 3-2: Income sources
This activity sheet is from Module 3 of the Financial Literacy Facilitator Resources. Tracking your income sources. To view full Financial Literacy Facilitator Resources, click here.
Activity sheet 3-1: The ‘B’ word – budget
This activity sheet is from Module 3 of the Financial Literacy Facilitator Resources. What do you think about when you hear the word “budget’? To view full Financial Literacy Facilitator Resources, click here.
What words or feelings come to mind?
Handout 2-8: Glossary
This activity sheet is from Module 2 of the Financial Literacy Facilitator Resources from Prosper Canada. Glossary for income and taxes module. To view full Financial Literacy Facilitator Resources, click here.
Handout 2-7: Resources
This activity sheet is from Module 2 of the Financial Literacy Facilitator Resources from Prosper Canada. Resource list for income and taxes module. To view full Financial Literacy Facilitator Resources, click here.
Activity sheet 2-6: Income and taxes
This activity sheet is from Module 2 of the Financial Literacy Facilitator Resources from Prosper Canada. Goal setting for filing your income taxes. To view full Financial Literacy Facilitator Resources, click here.
Handout 2-4: Filing your taxes
This handout is from Module 2 of the Financial Literacy Facilitator Resources from Prosper Canada. How to file your taxes. To view full Financial Literacy Facilitator Resources, click here.
Handout 2-3: Reading a pay stub
This handout is from Module 2 of the Financial Literacy Facilitator Resources from Prosper Canada. How to read a pay stub. To view full Financial Literacy Facilitator Resources, click here.
Activity sheet 2-2: Reading David’s pay stub (quiz)
This activity sheet is from Module 2 of the Financial Literacy Facilitator Resources from Prosper Canada. Reading David's pay stub - a quiz. To view full Financial Literacy Facilitator Resources, click here.
Activity sheet 2-5: Maria and Fernando’s story
This activity sheet is from Module 2 of the Financial Literacy Facilitator Resources from Prosper Canada. Maria and her husband Fernando worked together cleaning a big office building at night. They were hired by a man who ran a large cleaning company. They each got a paycheque twice a month. In February, it was time to do income tax for their previous year’s income. To view full Financial Literacy Facilitator Resources, click here.
Managing your money #7: Preparing for tax filing
Even if you make no money, you should file a tax return each year. You may be eligible for a refund (money back). Filing your taxes triggers access to government benefits that you can’t get any other way. This worksheet will help you gather the information you will need at tax time. You will need a file folder, an envelope, or a small box to put all of your paperwork in. This is worksheet #7 from the booklet 'Managing your money'.
Pervasive and profound: The impact of income volatility on Canadians
Income volatility describes income which is inconsistent (not received on a regular and predictable basis), unstable (amount varies each time it is received), and that fluctuates month to month by a significant percentage. TD’s report, Pervasive and Profound, has found that Canadians experiencing income volatility are more likely to report feelings of financial stress and lower overall financial health. They are also significantly more likely to see themselves falling behind financially and much less likely to feel confidence in their financial future. The survey findings show that income volatility is more likely to be experienced by part-time, self-employed, seasonal workers and the unemployed. The TD report uses Canadians’ reported behaviours and perceptions in the areas of saving, spending, borrowing and planning to gauge their overall financial health. In all four categories, those with higher income volatility show significantly lower financial health.
Managing your money #6: Setting a savings goal
Setting a savings goal means that you have decided how much money you can put away, and what you are going to save for. This activity can help you write down some money goals and when you would like to achieve them. You can build savings by putting aside small amounts on a regular basis. This is worksheet #6 from the booklet 'Managing your money'.
Managing your money #5: Monthly budgeting
When you make a budget, you give yourself a clear picture of your financial situation. A budget compares your income to your expenses, all in one place. This is worksheet #5 from the booklet 'Managing your money'.
Managing your money #4: Tracking your bills
Knowing what bills you have and when they are due can help you plan your spending. This activity will help you to be aware of two things: how much you owe each month, and at what time of the month that money is due. This will help you to pay bills on time, and avoid late fees. This is worksheet #4 from the booklet 'Managing your money.'
Managing your Money #3: Tracking your spending
Keeping track of where your money goes during the month is another helpful step towards making a budget. Then you will be able to compare your spending with your income. This is worksheet #3 from the booklet 'Managing your money.'
Managing your money #2: Tracking your regular income
Income is the money that comes into your household. This worksheet will help you see the ‘big picture’ of your income and other resources. Then you can think about how to plan your expenses. This is worksheet #2 from the booklet 'Managing your money.'
Breaking down barriers to tax filing for people living on low incomes – Infographic
This infographic by Prosper Canada summarizes the barriers to filing taxes faced by people living on low incomes. These barriers include access challenges, fear, lower literacy, and other challenges.
Investing in a Post Secondary Education Delivers a Stellar Rate of Return (TD Economics Topic Paper)
We ask because we care. The Tri-Hospital + TPH Health Equity Data Collection Research Project Report
Examining the Canadian Education Savings Program and its Implications for US Child Savings Account (CSA) Policy
This report analyzes the Canadian experience with education savings programs, as the US moves towards more comprehensive Children's Savings Account policy.
What can we learn about low-income dynamics in Canada from the Longitudinal Administrative Databank?
Caught in the Middle: Some in Canada’s Middle Class Are Doing Well; Others Have Good Reason to Worry
Financial Empowerment: Improving financial outcomes for low-income households
Financial Empowerment is a new approach to poverty reduction that focuses on improving the financial security of low-income people. It is an evidence-driven set of interventions that have proven successful at both eliminating systemic barriers to the full financial inclusion of low-income people and providing enabling supports that help them to acquire and practice the financial skills and behaviours that tangibly improve their financial outcomes and build their financial security. The Financial Empowerment approach focuses on community level strategies that encompass five main types of interventions that have been identified as both necessary for low-income households to improve their financial outcomes, and effective at helping them to do so.
The Real Cost of Payday Lending
Since the early 1990s payday lending businesses have become increasingly prolific in most parts of Canada, including Calgary. Social agencies and advocates working to reduce poverty view payday lenders and other fringe financial businesses as problematic for those looking to exit the cycle of poverty. Payday lenders charge interest rates that, when annualized, top 400%. The industry justifies this by stating that comparisons to an annual rate are unfair as loans are not meant to or allowed to last longer than two months. However, the fact remains that these businesses charge far more for credit than mainstream financial institutions and are more prevalent in lower income neighbourhoods.
The Town with No Poverty: The Health Effects of a Canadian Guaranteed Annual Income Field Experiment
